Abstract
We investigate which practical constraints are imposed by foregrounds on the detection of the B-mode polarization generated by gravitational waves, in the case of experiments of the type currently being planned. As the B-mode signal is probably dominated by foregrounds at all frequencies, the detection of the cosmological component depends drastically on our ability to remove foregrounds. We provide an analytical expression with which to estimate the level of the residual polarization for Galactic foregrounds, according to the method employed for their subtraction. We interpret this result in terms of the lower limit of the tensor-to-scalar ratio r that allows us to disentangle the cosmological B-mode polarization from the foreground contribution. Polarized emission from extragalactic radio sources and gravitational lensing is also taken into account. As a first approach, we consider the ideal limit of an instrumental noise-free experiment: for full-sky coverage and a resolution of 1°, we obtain a limit of r~ 10−4. This value can be improved by high-resolution experiments and, in principle, there is no clear fundamental limit on the detectability of the polarization of gravitational waves. Our analysis is also applied to planned or hypothetical future polarization experiments, taking into account expected noise levels.
1 Introduction
Standard cosmology is based on the inflationary paradigm, which provides a good description of the observed Universe. As well as a flat Universe, inflation predicts a Gaussian, adiabatic and nearly scale-invariant spectrum of primordial perturbations. However, inflation lacks clear physical support and alternative theories leading to the present Universe have been investigated (e.g. Khoury et al. 2001).
A further prediction of inflationary models is the presence of tensor perturbations to the spatial metric (gravitational waves). The detection of these perturbations would be an extraordinary way to distinguish inflation from other competing scenarios and, at the same time, to constrain the properties of the inflationary potential (Dodelson, Kinney & Kolb 1997).
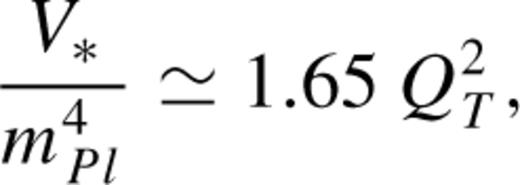

The detectability of the contribution of tensor perturbations is a much more promising way of exploiting CMB polarization measurements. The polarization field can be divided into a curl-free component of even parity called ‘E-mode’, and a curl component of odd parity, ‘B-mode’ (Kamionkowski, Kosowsky & Stebbins 1997; Zaldarriaga & Seljak 1997). While the former is generated by both scalar and tensor perturbations, B-mode polarization arises only from tensor perturbations and thus carries a direct imprint of the inflationary epoch. Nevertheless, the B-mode intensity is expected to be extremely weak, and even for optimistic values of r the rms signal is only a fraction of μK, less than 1 per cent of the level of temperature anisotropies at degree scales. Future experiments will need to reach extraordinary sensitivities to be able to detect such a low signal.
Gravitational waves produced during inflation are not the only possible source of primordial B-mode polarization. For example, the existence of tangled primordial magnetic fields or cosmic strings would generate a vector component of metric perturbations, providing a contribution to the B-mode polarization on small angular scales (Seshadri & Subramanian 2001; Subramanian, Seshadri & Barrow 2003; Pogosian et al. 2003). In any case, the discussion of these sources of polarization is outside the scope of this work.
Even if the instrumental sensitivity appears to be the biggest problem for detecting tensor-induced polarization, important constraints also come from the presence of other sources of B-mode polarization, e.g. foregrounds and effects that mix CMB E- and B-modes. The most relevant mode-mixing effect is the result of gravitational lensing produced by large-scale structures, which converts a fraction of the CMB E-mode component to B-mode (Zaldarriaga & Seljak 1998). Different authors (Hu & Okamoto 2002; Kesden, Cooray & Kamionkowski 2003; Seljak & Hirata 2003) have presented methods of reconstructing the gravitational lensing potential using information from the CMB polarization itself and removing the lensing contamination. The problem of a correct separation between the E- and B-modes in the presence of partial sky coverage, pixelization and systematic effects has also been widely dealt with in the literature (see Lewis, Challinor & Turok 2002; Bunn 2002; Bunn et al. 2003; Hu, Hedman & Zaldarriaga 2003; Lewis 2003; Challinor & Chon 2004), and a suitable formalism by which to minimize their influence has been provided.
Another critical source of confusion for the detection of the CMB polarization is expected from foreground contamination. Apart from the free-free emission that is not polarized, foregrounds have been shown to have, in general, a high degree of polarization equally shared between the E- and B-modes: synchrotron emission is on average 20-30 per cent polarized, while dust and extragalactic sources can be polarized anywhere from a few per cent to 10 per cent or more. Foregrounds are expected to dominate the sky B-mode polarization at all frequencies and angular scales, even for high values of r. On the other hand, they are also a serious problem for the CMB E-mode signal which is at most 10 per cent of temperature anisotropies, but may be significantly less on large angular scales.
A secondary B-mode polarization is also generated by the scattering of the CMB photons from ionized gas in galaxy clusters or in a patchy reionization scenario (see Hu 2000; Liu et al. 2001; Baumann, Cooray & Kamionkowski 2003; Santos et al. 2003). However, these effects produce a polarization that is several orders of magnitude below the dominant contributions.
The main question that this paper addresses is how Galactic and extragalactic foregrounds (including the gravitational lensing contamination) limit the detectability of the CMB B-mode polarization. In terms of cosmological constraints, we want to estimate the lower limit of r (hence of the energy scale of inflation) below which the signal from tensor perturbations cannot be distinguished by polarization measurements. The case of an ideal (i.e. noise-free) experiment is considered first, then the same analysis is also applied to planned or hypothetical experiments, giving hints on the best strategy for future missions.
2 Intensity Level of B-Mode Polarization for CMB and Foregrounds
In this section we discuss the expected level of the polarized signal for the CMB and foreground emission as a function of the observing frequency ν and the angular scale. The results are presented in Figs 1 and 2. The left-hand panel of Fig. 1 shows the dominant foregrounds in the ℓ-ν space. The non-shaded area is where the CMB E-mode is higher than the E-mode contribution of the foreground. The diffuse Galactic emission (synchrotron and dust emission) is essentially the strongest foreground in polarization. Only at high ℓ and frequencies lower than 100 GHz do extragalactic radio sources start to be relevant. We notice how the ‘cosmological window’ (the ℓ-ν region where CMB exceeds foregrounds emission) is strongly reduced as compared to temperature fluctuations, especially at large angular scales. In the right-hand panel of Fig. 1, we consider the polarization level of Galactic emissions but reduced by an order of magnitude (this is, at least, what we expect to reduce in a multifrequency experiment). In this case, extragalactic radio sources have already become an important contribution towards ℓ≳ 100, as well as the polarization induced by gravitational lensing at 100 ≲ ν ≲ 200 GHz. Now the non-shaded area represents the ℓ-ν region dominated by the CMB B-mode polarization for a cosmological model with r= 0.1. As expected, it is confined only to ℓ ≲ 100.

The dominant foreground in polarization as a function of the frequency and the angular scale. Synchrotron (labelled ‘Sync’): upward-slanting lines (light blue online); dust (Dust and Dust/10): downward-slanting lines (yellow); extragalactic radio sources (PS): darker shading, downward-slanting lines (brown); gravitational lensing (Lens): darker shading, upward slanting lines (green). Galactic foregrounds are modelled by equations (14)-(15) (see also Fig. 2b). For extragalactic radio sources we use a flux limit of 1 Jy. Left panel: the non-shaded area is where the CMB E-mode is the dominant polarized signal. Right panel: as in the left panel but after reducing the synchrotron and dust emission by a factor of 10. Here the non-shaded area indicates the region where the CMB B-mode (considering r= 0.1) is higher than the foreground contribution.

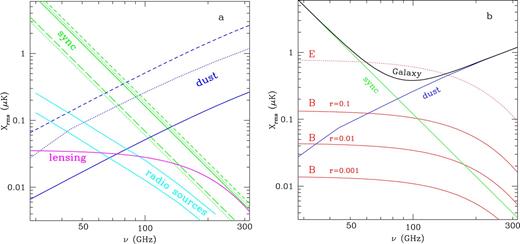
The rms value of foreground and CMB X = E, B modes versus the frequency, as predicted by an experiment with FWHM = 1°. Panel(a): Estimates of foregrounds from different data. Synchrotron (labelled ‘sync’, green online): 10-30 per cent of the WMAPΔTrms (dotted lines); estimates from Brouwn & Spoelstra data (dashed line), from high-resolution low-latitude polarization surveys (solid line) and from observations of high-latitude polarization (Abidin et al. 2003; long-dashed line). The spectral index is βs=−3.1. Dust (‘dust’, dark blue): 5 per cent of the WMAPΔTrms (dashed line) and the result from the Prunet et al. (1998) model (solid line). For the frequency spectrum we consider a one-component dust model with T= 18 K and emissivity α= 1.7. The dotted line is obtained by the ‘100 μm map’ (Schlegel et al. 1998) extrapolated to microwave frequencies using model 8 of Finkbeiner et al. (1999). Radio sources (‘radio sources’, light blue): estimates from Tucci et al. (2004), taking the flux limits 1 and 0.2 Jy. Lensing-induced polarization (‘lensing’, magenta). Panel (b): The black solid line is the total Xrms contribution of foregrounds, taking for the synchrotron emission 20 per cent of the WMAP estimate and βs=−3.1; for the dust model 8 of Finkbeiner et al. (1999). CMB (‘E’ and ‘B’, red lines): Erms (dotted line) and Brms (with r= 0.1, 0.01, 0.001; solid lines) for the ‘concordance’ model with t= 0.1.


2.1 Cosmic microwave background
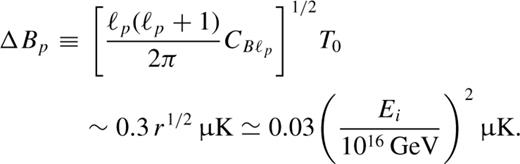
In Fig. 2(b) we report the expected values of Brms for r= 0.1, 10−2 and 10−3 (shown as solid red lines online). As shown in equation (4), these values scale as r1/2. If only very large scales are considered, Brms is strongly dependent on τ and exceeds 0.1 μK for τ and r > 0.1. However, at 1° resolution, τ is less relevant but not negligible (Brms increases by a factor of 2 changing τ from 0 to 0.17). In the plot we consider τ = 0.1 (a conservative value compared to the WMAP best-fitting one). The B-mode spectrum is less sensitive to other cosmological parameters. We fix those in agreement with the ‘concordance model’ (Ω0= 1, ΩA= 0.7, Ωb= 0.05 and h= 0.7).
The detection of the CMB E-mode polarization is much easier than that of B-mode polarization, and it is even better with sub-degree resolution experiments (see Fig. 1). At these angular scales, the Degree Angular Scale Interferometer (DASI) (Kovac et al. 2002) achieved the first direct measure of E-mode polarization, while more recent observations have been provided by DASI (Leitch et al. 2005), the Cosmic Anisotropy Polarization Mapper (CAPMAP) (Barkats et al. 2005) and the Cosmic Background Imager (CBI) (Readhead et al. 2004). At 1° angular scales the value of Erms is less than 1 μK with a polarization degree of only a few per cent or less. Nevertheless, the CMB E-mode is still the dominant contribution in a wide range of frequencies, approximately between 60 < ν < 150 GHz.
Finally, we plot in Fig. 2(a) the level of the B-mode polarization induced by the gravitational weak lensing of large-scale structures (line labelled ‘lensing’, magenta online). This estimate is obtained using the cmbfast package.3
2.2 Synchrotron emission
Among all foregrounds, synchrotron emission is the most polarized (up to ~75 per cent). It is expected to be the dominant component at low frequencies (ν ≲ 70 GHz). Total-intensity data are available up to ~20 GHz, while polarization observations of the synchrotron emission are obtained only at a few GHz or less. Estimates of the amplitude of the polarized synchrotron emission at cosmological frequencies are especially complicated for two reasons: the steepening of the spectral index that may occur at ν ≲ 20 GHz, and the frequency dependence of the degree of polarization.
The synchrotron spectral index, βs, is computed on nearly a full sky, using the surveys at 408 MHz (Haslam et al. 1982), 1.4 GHz (Reich & Reich 1986) and at 2.3 GHz (Jonas, Baart & Nicolson 1998) by Giardino et al. (2002) and Platania et al. (2003). These analyses show βs to vary across the sky between −2.5 and −3.0, with an average value 〈βs〉 ≃ −2.7 and a dispersion of 0.1–0.2 at sub-degree angular resolution. A relevant steepening ((〈βs〉 ≈−3 out of the Galactic Plane) is found from the first-year data of WMAP at 23 GHz (Bennett et al. 2003). Bernardi et al. (2004) studied the distribution of the spectral index computed between 1.4 and 23 GHz: the frequency spectrum is observed to be rather flat along the Galactic Plane, but steeper at high Galactic latitudes with a typical value βs=−3.1. A further steepening is also suggested in the 23–41 GHz range by Bennett et al. (2003), although it has yet to be confirmed. In the following, we shall assume βs=−3.1 as the mean spectral index for the synchrotron emission at all considered frequencies.
Estimates of the rms signal of X=EB modes for the synchrotron emission are reported in Fig. 2a (lines labelled ‘sync’, green online). A set of estimates obtained in different ways is considered, which permits us to get a range of plausible levels. First we scale down unpolarized synchrotron emission as follows: the full-sky synchrotron map at 23 GHz, obtained from WMAP data after component separation with the Maximum Entropy Method (Bennett et al. 2003) and smoothed by a Gaussian beam with FWHM = 1°, is used to compute the rms amplitude of temperature fluctuations at high latitudes (|b| > 20°). We find ΔTrms= 82.6. From the Brouw & Spoelstra (1976) observations (up until now, the only available data of synchrotron polarization on a large fraction of the sky), Spoelstra (1984) found that on 1° scales, the fractional polarization at 1.411 GHz is typically 10–20 per cent with the highest value being 35 per cent. Taking into account that Faraday rotation can reduce the polarization degree at this frequency, we assume that synchrotron emission is polarized between 10 and 30 per cent (as lower and upper limits). The resulting estimates are shown with dotted lines in Fig. 2(a).
Secondly, estimates of Xrms can also be directly achieved from polarization data. Bruscoli et al. (2002) use the Brouw & Spoelstra (1976) survey to compute the E- and B-mode APS in three patches with high signal-to-noise ratio centred at the latitudes b= 5°, 44.5°, 72.5°. They find that the APS can be well approximated by a power law with a quite flat slope, ≳−2. Taking as the ‘average’ spectrum at 1.4 GHz CXℓ= 0.01ℓ−1.8 (K2), we find Xrms (1.4 GHz) = 0.11 K at 1° resolution (dashed line in Fig. 2a). Similar results are also obtained from the analysis of high-resolution surveys at low Galactic latitudes (Duncan et al. 1997,1999; Uyaniker et al. 1999): extrapolating the polarization APS provided by Tucci et al. (2000) and Bruscoli et al. (2002) to low ℓs, we find Xrms≃ 0.02 K at 2.4 GHz (solid line in Fig. 2a). However, these estimates probably have to be considered as upper limits because they come from observations of the Galactic Plane or of highly-polarized regions. Their very good agreement with the 30 per cent WMAP predictions shown by Fig. 2(a) confirms that a polarization degree up to 30 per cent can be observed in highly-polarized areas, although it may be not the typical percentage on the sky. The upper lines in Fig. 2(a) may be somewhat pessimistic estimates.
Finally, the recent observations of the high-Galactic latitude polarization with the Effelsberg Telescope at 1.4 GHz (Abidin et al. 2003) point out structures in polarization on scales of several degrees with a fractional polarization up to 30–40 per cent in the brightest regions and a rms Q and U signal of 50 mK. This value, extrapolated to WMAP frequencies, corresponds to the WMAP result with an average polarization degree of 10 per cent (see long-dashed line, Fig. 2a). Nevertheless, as the polarization level at 1.4 GHz can be significantly reduced by Faraday depolarization, a percentage of 20 per cent for the polarized synchrotron emission may be more realistic at microwave frequencies. The lower lines in Fig. 2(a) are thus probably somewhat optimistic.
2.3 Dust emission
Millimetric or submillimetric measurements of the Galactic dust polarization are usually concentrated in Galactic clouds and star-forming regions with arcmin angular resolution (e.g. Hildebrand et al. 1999; Greaves et al. 1999). They show a few per cent polarization and no clear frequency dependence. The first observations on large angular scales of the polarization of the Galactic dust emission are provided by Archeops at 353 GHz (Benoît et al. 2003). The Archeops data show a significantly large-scale polarized emission in the Galactic Plane, with a polarization degree of 4–5 per cent, with several clouds of a few square degrees appearing to be polarized at more than 10 per cent.
Total-intensity observations at infrared wavelengths, where the thermal dust emission is very dominant, have been obtained by the IRAS and COBE (DIRBE) satellites. Combining these data, Schlegel, Finkbeiner & Davis (1998) generated a full-sky map at 100 μm with sub-degree resolution. A tentative extrapolation of the 100 μm map to microwave frequencies was carried out by Finkbeiner, Davis & Schlegel (1999), assuming different dust emissivity models. They used the Far-Infrared Absolute Spectrometer data in the 100–2100 GHz range to constrain dust properties. The best agreement is achieved with a two-component model, consisting of a mixture of silicate and carbon-dominated grains (see model 8 of Finkbeiner et al. 1999). Extrapolating the 100-μm map to 100 GHz with this model, we find ΔTrms= 7.4 μK for a 1° resolution. The dust rms intensity at this resolution can also be estimated from WMAP data: using the Galactic emission models by Bennett et al. (2003), it is found that ΔTrms= 13 μK at 93.5 GHz, significantly higher than the Finkbeiner et al. (1999) value. However, because in the WMAP frequency range the dust emission is only a secondary contribution, this value is still controversial. The predictions on the rms polarization presented in Fig. 2(a) assume a typical degree of polarization for the interstellar diffuse dust emission of 5 per cent, in agreement with Archeops results (dotted and dashed lines in Fig. 2a, blue online).
Finally, Prunet et al. (1998) provide a model of the dust polarized emission using the three-dimensional H i maps of the Leiden-Dwingeloo survey at high Galactic latitudes. Different hypotheses on dust grain properties and alignment are assumed. As their main result, they estimate the dust polarization APS at 100 GHz to be CXℓ ≃ 10−3ℓ−1.4 (μK)2, corresponding to Xrms= 0.051 μK at 1° resolution (solid line in Fig. 2a). This value is significantly low compared to previous ones and require a mean polarization degree of less than 1 per cent to be consistent with total-intensity results.
2.4 Extragalactic sources
Extragalactic radio sources contribute significantly to temperature and polarization fluctuations only at small angular scales. At degree scales their polarized signal is a small fraction of the total foreground, even if it can exceed the cosmological B-mode for a low value of r. Predictions on the polarization properties of radio sources at microwave frequencies and on their contamination for CMB measurements are provided by Tucci et al. (2004), using the evolutionary model of Toffolatti et al. (1998) which predicts the number counts of sources at cm and mm wavelengths. In Fig. 2(a) we report the rms polarization assuming that all sources with flux density higher than 1 or 0.2 Jy have been completely removed (lines labelled ‘radio sources’, light blue online).
At frequencies higher than 100 GHz, the contribution of dusty galaxies should also be taken into account. However, the sparsity of data on polarization at sub-mm wavelengths makes reliable predictions difficult. In any case, we expect that the polarization degree from the dust emission in external galaxies is not higher than the polarization degree observed in the Milky Way, i.e. only a few per cent. Supposing a polarization of 2 per cent (Hildebrand 1996; Greaves et al. 2000; Matthews & Wilson 2002), Fig. 1 shows that the dusty galaxies contribution never overcomes the other foregrounds at all frequencies lower than 1000 GHz and at ℓ < 3000. Polarization from dusty galaxies will be neglected in this work.
2.5 Other sources of polarization
Here we give a brief description of some secondary sources of polarized emission, although they will not be taken into account in the analysis.
The existence of an anomalous dust-correlated emission, far brighter than the expected thermal dust emission, has been well detected at ~10–30 GHz (e.g. Kogut et al. 1996; de Oliveira-Costa et al. 1999; Finkbeiner 2003). One possible explanation is the electric dipole emission from rapidly rotating small dust grains, known as ‘spinning dust’ (Draine & Lazarian 1998). This emission is expected to be polarized if grains are aligned with the magnetic field. In any case, as shown by Lazarian & Finkbeiner (2003), the polarization is marginal for ν > 35 GHz. Another possibility is the magneto-dipole emission from strongly magnetized grains (Draine & Lazarian 1999). The polarization arising from this mechanism depends on the dust composition and structure, and can be substantial at microwave frequencies (Lazarian & Finkbeiner 2003).
Finally, in the presence of a temperature quadrupole, the scattering of the CMB photons by free electrons in galaxy clusters leads to a secondary linear polarization. In addition to the primary CMB quadrupole, another important origin of temperature quadrupole is due to the peculiar velocity of clusters. However, the contribution to the B-mode polarization from this secondary signal is decidedly low, several orders of magnitude below the lensing-induced polarization on large scales (for a review, see Cooray, Baumann & Sigurdson 2004).
3 Galactic Foreground Subtraction and Residual Power Spectrum
Fig. 2 clearly shows that the contribution of Galactic foregrounds to the B-mode polarization dominates over the CMB signal at all frequencies, even in the most optimistic cases. The knowledge of foreground emissions and the ability to remove them assume therefore a primary role for the possibility of observing the polarization induced by gravitational waves. Multifrequency observations are thus absolutely necessary, especially on large scales. During last several years, many methods have been suggested for performing the component separation of the microwave sky. Some of them adopt Bayesian approaches (e.g. MEM by Hobson et al. 1998 and Wiener filtering by Tegmark & Efstathiou 1996; Bouchet & Gispert 1999) whereas others favour ‘blind’ techniques (e.g. the Spectral Matching Independent Component Analysis by Delabrouille, Cardoso & Patanchon 2003a and the fast Independent Component Analysis by Maino et al. 2002). In this work we do not want to go into the details of different techniques and assumptions for the separation of components. Our aim is to estimate the level of residual Galactic foregrounds left in the clean maps after their subtraction. We propose the following hypotheses: (i) a template for synchrotron and dust emission (the only Galactic foregrounds considered) is available; (ii) their spectral behaviour is estimated in the frequency range of interest. A linear subtraction of Galactic foregrounds is then employed extrapolating templates to the ‘cosmological’ frequency. The instrumental noise present in templates and the uncertainty about the frequency spectrum of foregrounds are taken into account in order to compute the residual polarization. Compared to standard techniques for component separation, this method is, in principle, less accurate. However, it provides qualitative estimates for the residual foregrounds that are good enough for the aim of this work. Its simplicity allows us to compute analytically the power spectrum of residual Galactic contaminants and, in addition, the method only requires minimal assumptions regarding the foregrounds and their statistical properties.
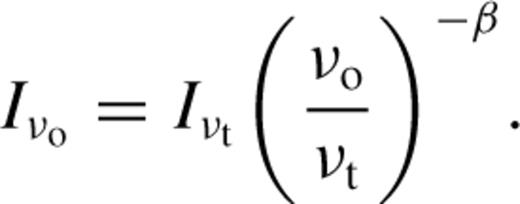
 and
 the template foreground intensity and the measured spectral index in the sky direction
 , while the difference between these quantities and the actual ones is
 and
 respectively. If we extrapolate the template to the observational frequency using equation (5), the residual foreground left in the map at νo after foreground subtraction is:
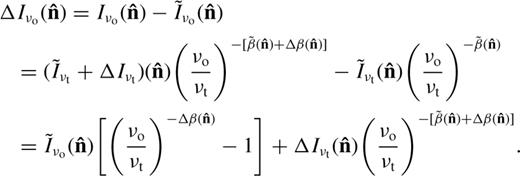

 consists of one part that is proportional to the uncertainty on the spectral index, and another that is proportional to the error (or noise) on the foreground polarization at the template frequency. Extending this result to the case of polarization measurements is trivial:
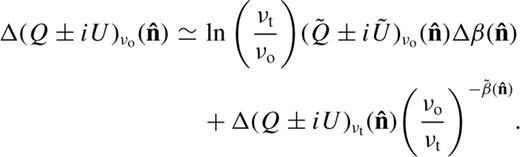
 ) is obtained by the convolution of the spectrum of the estimated foreground polarization at νoCfXℓ, with that of the uncertainty on the spectral index Δβ, Cβℓ. The mathematical calculations are reported in Appendix A (see below). We get


 . However, keeping again only first order terms [in particular, we replace
 with the average value of the spectral index,
 ] and supposing the polarization uncertainty in the template to behave like white noise, we find that
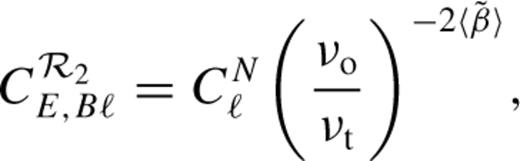

3.1 Residual power spectrum due to spectral index uncertainties
In order to estimate the power spectrum of the residual foreground polarization by equations (9)-(10), the knowledge of three angular spectra is required: CfXℓ (polarization spectrum of the Galactic foregrounds which can be directly computed from the template maps); CNℓ (spectrum of the white noise in foreground templates); Cβℓ (spectrum of the spectral index error). Here, we focus on the latter which is the most critical to define the behaviour of  . We consider two different extreme cases:
3.1.1 (C1) Average spectral index
The template for a Galactic foreground can be extrapolated to the observational frequency using the sky-average spectral index. In this case, the error on the spectral index will be the difference between  and the estimated average value
 (assuming no systematic effect in the estimation). Because the spectral index of Galactic emissions is directly related to physical conditions of the region where the emission is produced both for synchrotron (spectral index depends on the energy distribution of electrons) and for dust emission (dependent on the temperature and the emissivity of grains), we expect that maps of
 and, consequently, of the error
 will show coherent structures like those observed in total-intensity templates. This is visually observed comparing the maps of the synchrotron spectral index provided by Giardino et al. (2002) and Bernardi et al. (2004) and the total-intensity ones. More quantitatively, we estimate the power spectrum of
 obtained by Giardino et al. (2002) from low-frequency surveys, and we find a power-law spectrum with a slope of ~−3, in agreement with the behaviour of the synchrotron intensity spectra (Tegmark & Efstathiou 1996; Bouchet, Gispert & Puget 1996; Bouchet & Gispert 1999). We expect it is same for the dust emission.
Therefore, in this case (C1) we assume that Cβℓ is proportional to the total-intensity APS for the Galactic foregrounds. The normalization of Cβℓ is obtained by fixing the dispersion of the spectral index around its average value, σβ, and using the relation:  , where Wℓ is the window function corresponding to the resolution at which the dispersion σβ has been computed.
The residual power spectrum  obtained under this hypothesis is shown as a solid line in Fig. 3. Hereafter, we take: Cβℓ∝ ℓ−3 and σβ= 0.2, in agreement with the results found by Giardino et al. (2002) and Bernardi et al. (2004) for the synchrotron emission at high Galactic latitudes, and by WMAP measurements for the dust spectral index (see fig. 9 of Bennett et al. 2003). The polarization spectra of the Galactic foregrounds are assumed to be of the form CfXl=l−1.8. Both spectra are smoothed by a window function with FWHM = 1°. We notice that the residual spectra
 have the same slope of the foreground polarization spectra as expected (except for the first ls), but with an amplitude a factor ~100 lower (here we have considered A= 1 in equation 9).
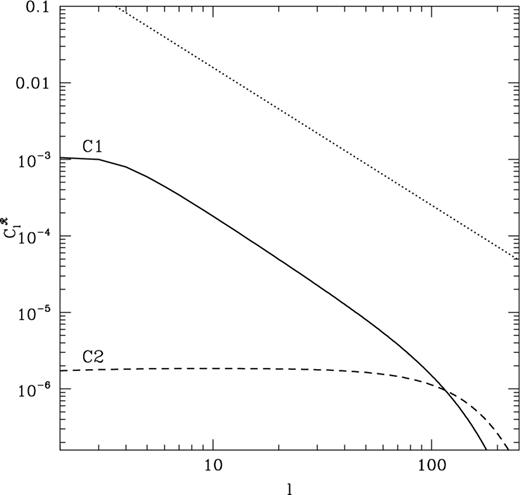
Residual polarization spectra  under the hypothesis of average (C1; solid line) and pixel-dependent (C2; dashed line) spectral index for Galactic foregrounds. The dotted line is a power law normalized to unity and with a slope of −1.8.

3.1.2 (C2) Pixel-dependent spectral index
As our second case, we assume that the foreground template is extrapolated to the observational frequency using a spectral index estimated pixel by pixel. Moreover, we suppose that the error on these spectral indices,  , behaves like white noise. Consequently, its power spectrum Cβℓ will be constant. The amplitude of Cβℓ clearly depends on the noise in data used to compute the spectral index. As a working case, we assume that the average error on the spectral index is equal to the dispersion in the spectral index distribution, i.e. the above value σβ= 0.2. Even though this assumption is probably very conservative, it is nonetheless interesting because it allows us a direct comparison to the results of case C1, as the total power of the error is the same, but distributed differently in l. Fig. 3 (dashed line) shows that the residual APS behaves like a white noise spectrum (at least up to the resolution scale) with a very small amplitude at large angular scales: at ℓ < 10 it is 10−5−10−6 times lower than CfXl, and two orders of magnitude lower than predictions for case C1. Considering that the power of the CMB B-mode polarization is concentrated at degree scales (l < 100), this second case for foreground subtraction is much more favourable, removing particularly well the Galactic foregrounds on the largest angular scales.
4 Uncertainty on the Tensor-To-Scalar Perturbations Ratio in an Ideal Experiment Including Foregrounds

 . The quantity ΔCXl is the uncertainty on the X=EB power spectra at the multipole l:

As we have previously discussed, the CMB polarization at degree scales depends strongly on two cosmological parameters, the tensor-to-scalar ratio r and the optical depth of the Universe t. Polarization spectra are also affected by other parameters, but polarization measurements are of particular importance only for r and t, which can be at best poorly constrained with temperature. Therefore, we consider in the Fisher matrix only the parameters ai={t, r}, all the other cosmological parameters being supposed to be already known. The results on the tensor-to-scalar ratio are given in terms of the quantity rlim, defined as the value of r under which the relative error on r is 0.3 (i.e. corresponding to about a 3-σ error). On the contrary, the uncertainty on the parameter t will be not discussed, as its value is generally estimated, with high precision, to be less than 10 per cent in almost all the cases we have considered.


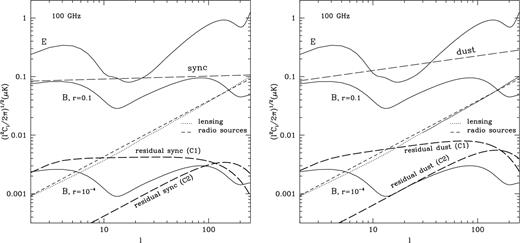
Polarization power spectra at 100 GHz (in thermodynamic temperature): CMB E-mode (upper solid line) and B-mode for r= 0.1 and 10−4 (lower solid lines); synchrotron emission (left plot, dashed lines); dust emission (right plot, dashed lines); gravitational lensing (dotted lines); extragalactic radio sources with S < 1 Jy (short dashed lines). The thick dashed lines show the residual contribution of the synchrotron and dust emission after their subtraction, following the two methods described in Section 3. In these spectra the effect of the beam (FWHM = 1°) starts to be noticeable at l~ 100.

We suppose that Galactic foregrounds are subtracted from data at 100 GHz using the prescriptions described in the previous section. In particular, we consider that a template for the synchrotron polarized emission is available at ν = 60 GHz and one for the dust at 140 GHz. Under these conditions and supposing noise-free templates, the noise term in equation (13) is given only by the residual Galactic polarization,  (thick dashed lines in Fig. 4), and extragalactic foregrounds. The rms amplitude of the Galactic polarization is reduced by a factor 20 or 60, according to the subtraction scheme used.
4.1 Constraints on r imposed by Galactic foregrounds
The Fisher matrix is used to estimate the uncertainty on r for our reference experiment. No contribution from extragalactic sources is taken into account. The results are shown in Fig. 5. The two different methods used to subtract Galactic foregrounds are considered: in the C1 case (the frequency spectrum for Galactic emissions is considered independently of the sky position) we find rlim= 8.3 × 10⁻⁵; a detection of the tensor polarization with lower amplitude can be achieved if the spectral law is estimated pixel by pixel (C2 case). In particular, a 3-σ detection is possible for r= 1.8 × 10⁻⁵. These very low values for rlim tell us that the Galactic foregrounds are subtracted in a very efficient way in both cases (as expected when the noise is negligible).
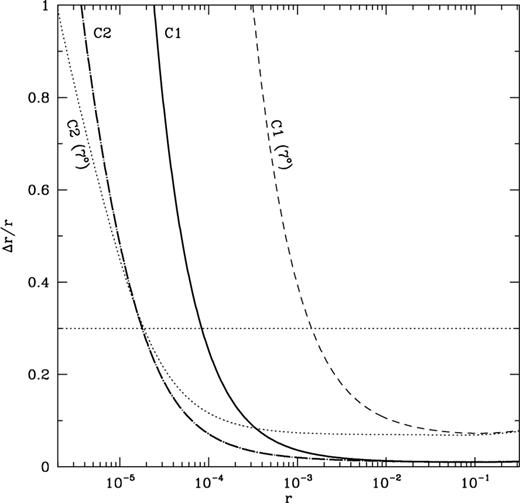
Fractional errors of r as a function of r for the reference experiment (full-sky, ‘noise-free’ and FWHM = 1°) in the two hypotheses on Cβℓ: C1 (solid line) and C2 (dot-dashed line). Dashed line (C1 case) and dotted line (C2 case) are for the same experiment but with FWHM = 7°. Only Galactic foregrounds are considered.

No improvement of the sensitivity on r is observed by increasing the instrumental resolution to angular scales smaller than 1°, confirming that all the information on the cosmological B-mode comes from ℓ≲ 100. If the resolution is reduced to FWHM = 7°, we find that rlim gets clearly worse only in the C1 case. On the contrary, the C2 results appear to be nearly independent of the resolution at least for FWHM = 7°, meaning that the largest scales (ℓ ≲ 30) are enough to provide a good detection of r. For a low-resolution experiment, the loss of information from l~ 100 is probably balanced by a decrease of the amplitude of  .
Finally, we have verified that previous results are nearly insensitive to the value of the optical depth. In fact, the reionization affects the B-mode APS only for ℓ ≲ 10, where the cosmic variance strongly constrains the precision on the r detection. Hereafter, the results are given for t= 0.1.
4.2 Effects of the extragalactic B-mode polarization on rlim
The next question is, how much do extragalactic radio sources and the polarization induced by gravitational weak lensing affect the estimate of rlim? At degree scales they provide only a secondary contribution to the B-mode polarization compared to the Galactic emissions. At 100 GHz, the radio-sources and lensing-induced B-mode spectra are constant with nearly the same amplitude, at least up to ℓ ≲ 300. However, as shown in Fig. 4, multifrequency experiments allow us to remove efficiently the Galactic foregrounds from polarization maps, and thus extragalactic polarization becomes the greatest contribution to the B-mode also at very large scales. Observations at different frequencies are not useful for the subtraction of point sources or of the lensing-induced polarization that require experiments with arcmin resolution. They become a critical problem for low-resolution experiments.
4.2.1 Extragalactic radio sources
In the last several years, a lot of effort has been put into developing methods able to detect extragalactic point sources in CMB maps and in estimating their intensity of emission (e.g. Tegmark & Oliveira-Costa 1998; Sanz, Herranz & Martínez-González 2001; Vielva et al. 2003). Complete catalogues of extragalactic sources with low flux limits are expected to be extracted from the forthcoming data. For example, Vielva et al. (2003), using a method based on the Spherical Mexican Hat Wavelet, showed that 90 per cent-completed catalogues up to ~200 mJy can be extracted by Planck observations at the frequencies of 100, 143 and 217 GHz. At the moment, these techniques have not been extended yet to polarization maps.
In any case, because we are only interested in reducing the contribution of point sources to the polarization maps, the best strategy is to exploit the total-intensity catalogues in order to mask all the pixels with bright sources. Supposing that total-intensity catalogues of radio sources will be available up to very low flux limits, the only restriction is the number of pixels that can be masked in a map without losing too much information. This is a strong constraint especially for low-resolution experiments. We fix at ten per cent the maximum percentage of beam-size pixels we can mask. For a full-sky experiment with FWHM = 1° (like the reference experiment), this corresponds to 3300 pixels, taking into account the Galactic Plane cut. According to the number counts of Toffolatti et al. (1998) model, the same number of radio sources is found at 100 GHz for fluxes S= 150 mJy.
Thus, we compute the relative error on r using the hypothesis that all the sources with S > 150 mJy have been masked (the APS amplitude of the remaining radio sources is 7.2 × 10⁻⁸ μK2). We find rlim= 1.4 × 10⁻⁴ and 6 × 10⁻⁵ in cases C1 and C2 respectively (see Fig. 6). In this figure we also report the results obtained if only the sources with S= 1 Jy are removed. We stress that as the contribution of extragalactic sources becomes higher, the rlim value is less affected by the amplitude of the residual Galactic polarization.
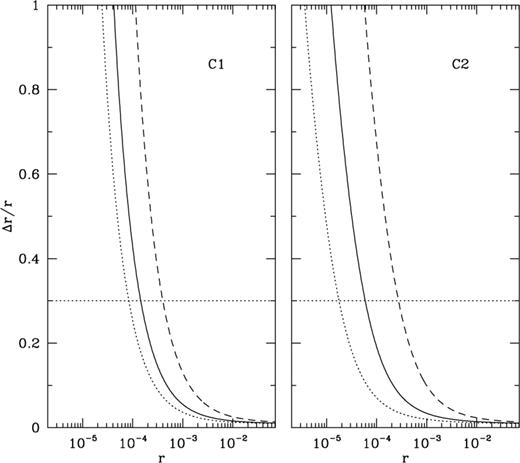
Fractional error of r for the reference experiment, considering the two different schemes of Galactic foreground subtraction (C1, left plot; C2, right plot). The contribution of radio sources with S < 150 mJy (solid lines) and S < 1 Jy is included (dashed lines). Previous results with no contribution from extragalactic foregrounds are shown as the dotted line.

Because the contribution of radio sources tends to decrease at frequencies higher than 100 GHz, it is interesting to study what occurs when the observational frequency is increased, νo > 100 GHz. We have considered νo= 140 GHz and the Galactic foreground templates at 60 and 220 GHz. However, the resulting rlim are significantly worse than in the reference case, confirming that 100 GHz is an appropriate frequency at which to detect the CMB B-mode polarization with this foreground subtraction scheme.
4.2.2 Gravitational lensing
The decontamination of B-mode polarization maps from the polarization induced by gravitational weak lensing can be achieved by reconstructing the projected mass distribution of large-scale structures (or the lensing potential). Hu & Okamoto (2002) showed that the best estimator for the projected mass distribution is provided by the correlation between the CMB E and B modes, which allows us to reconstruct the distribution power spectrum up to multipoles of l~ 1000. Different approaches have been suggested by Knox & Song (2002),Kesden, Cooray & Kamionkowski (2002) and Seljak & Hirata (2003): they show that high precision in the lensing reconstruction can be obtained only for low-noise experiments with arcmin resolution. In particular, table 1 of Seljak & Hirata (2003) provides the residual B-mode contamination as a function of the beam size and of the instrumental noise. The lensing ‘noise’ always decreases when instrumental noise and/or the resolution are improved. The authors suggest that in an ideal condition of a noise-free experiment with unlimited resolution, the lensing contamination could be removed completely. On the contrary, they argue that for wide-beam detectors (FWHM > 20 arcmin) the cleaning methods are practically useless.
So far, we have considered that the typical polarization experiment is full-sky with 1° resolution. In this case, the lensing contamination can become the dominant limitation for detecting the gravitational wave polarization with low values of r. A 3-σ detection, in fact, is possible only for r≳ 4 × 10⁻⁴ if the lensing noise is not subtracted (see dashed lines in Fig. 7). On the other hand, information from high-resolution experiments can be exploited: the Planck mission and upcoming ground-based experiments are expected to be able to measure the lensing-induced B-mode APS with a good precision (Bowden et al. 2004; Ganga 2004). Assuming the hypothesis that the lensing-induced spectrum can be reduced by a factor of 10 [as indicated by Knox & Song (2002) for their reference experiment], the previous results are improved significantly, especially in the C2 hypothesis, for which we get rlim≃ 5 × 10⁻⁵ (see Fig. 7).
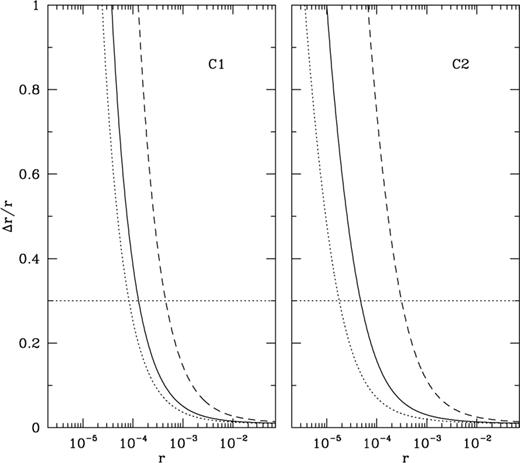
Fractional error of r for the reference experiment, considering the two different schemes of Galactic foreground subtraction (C1, left plot; C2, right plot). We include the contribution of the lensing-induced polarization: the total one (dashed lines) and reduced by a factor of 10 (solid lines). The dotted line indicates no contribution from extragalactic foregrounds.

4.3 Limits on r including all foregrounds
Finally, we show in Fig. 8 the results on Δr/r taking into account the following foreground contributions: (1) the residual Galactic polarized emission; (2) the contribution from extragalactic radio sources with flux S < 150 mJy; (3) the polarization induced by weak lensing, but with its power spectrum reduced by a factor 10. For the reference experiment we obtain rlim≃ 9 × 10⁻⁵ (1.8 × 10⁻⁴), using the C2 (C1) spectrum for the residual Galactic polarization. We want to stress again that, when extragalactic foregrounds are included, the value of rlim is nearly independent of the method (and hypothesis) employed for removing the Galactic foreground polarization. If we were able to completely subtract the Galactic emission, the resulting rlim (under previous conditions) would be 7 × 10⁻⁵, not far from the above values. It means that the limit of r~ 10−4 on the detectability of the polarization produced by gravitational waves is due essentially to radio sources and lensing, even in the case of a raw Galactic foreground subtraction (as in the C1 scheme).
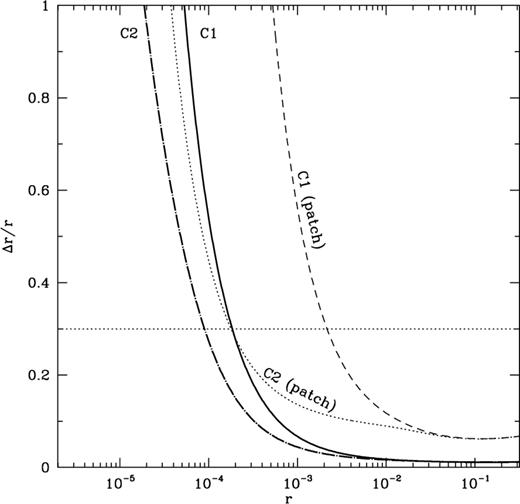
Fractional errors of r for the reference experiment, including all foregrounds: the two methods for Galactic polarization subtraction are considered (C1, solid line; C2, dot-dashed line). The dashed line (C1) and dotted line (C2) are for a small-area experiment without extragalactic contributions.

When extragalactic contributions are included, low-resolution experiments are much less effective at estimating r. In particular, extragalactic radio sources are a serious problem because of the difficulty of detecting and subtracting them. For example, considering FWHM = 7°, we find rlim~ 10−3 in the best case.
4.3.1 High-resolution, small-area experiment
An experiment with arcmin resolution could overcome the constraints imposed by extragalactic foregrounds. In fact, on the one hand, the number of arcmin pixels that can be masked to remove radio sources is much higher, reducing the flux limit to «150 mJy and making their contribution negligible (in a small area); on the other hand, the high resolution (with the ‘noise-free’ condition) allows us to reconstruct with high precision the lensing B-mode power spectrum directly from the data (Seljak & Hirata 2003). In particular, we study what occurs in an experiment covering a sky area of 30°× 30° in the hypothesis of a perfect subtraction of extragalactic foregrounds: the limited sky area strongly constrains the detectability of the tensor polarization, due to the cosmic variance on the low ℓ (as the uncertainty on r increases proportionally to f−1/2sky). Only if Galactic foregrounds are removed in an accurate way, as under the C2 conditions, is rlim similar to that found for a full-sky experiment (see the dotted line in Fig. 8).
5 Results from Future Experiments
In this section we apply the previous analysis to experiments characterized by a given sensitivity to the polarized emission. Practically, it means that we include the instrumental sensitivity in the noise term of the Fisher matrix. We also take into account the noise in template maps in order to estimate the APS of the residual Galactic polarization, by adding the term given in equation (10).
In the next few years, a large number of experiments have been planned with the explicit objective of measuring the CMB polarization (for a review on the polarization experiments see Delabrouille et al. 2003b). However, while they may provide an accurate estimate of the E-mode power spectrum at both large and small angular scales, for the forthcoming experiments the detection of the gravitational wave polarization is still a challenge and it will be possible only for high values of the tensor-to-scalar ratio r.
In the mean time, the Planck mission4 best satisfies the conditions for searching the ‘inflationary’ polarization: full-sky coverage and a good characterization of all the relevant foregrounds. In fact, a large frequency range is spanned and more than one frequency is dedicated to the study of the Galactic foregrounds, providing adequate knowledge of their spectral behaviour and template maps in polarization. On the other hand, the arcmin resolution allows us to detect point sources up to quite low fluxes and to have a first estimate of the gravitational lensing contribution. Nevertheless, the instrumental noise is still a very strong constraint: the sensitivity to Stokes parameters Q and U per square degree pixel is higher than 1 μK at all the frequencies (after 14 months), significantly higher than the expected rms value for the cosmological B-mode polarization. Taking the 100 GHz channel as the ‘observational frequency’ (and using the 30 and 217 GHz channels as templates for the synchrotron and dust emission respectively), we find that a 2-σ detection of the gravitational wave polarization is possible for r≃ 0.05. This result does not change if we do not include the contribution of foregrounds.
The research into gravitational wave polarization is also promising using ground-based experiments. As discussed above, the disadvantage of covering a limited area of the sky can be partially compensated for by the high resolution, which permits better control of the contribution provided by extragalactic sources and gravitational lensing. Experiments like PolarBear (see Ganga 2004), Clover (Taylor et al. 2004) or QUIET (Miller 2004) are planned to achieve a very good sensitivity, of the order of 0.1 μK or less, using arrays of 1000s of detectors in only two or three frequency channels. As an example, we discuss in detail the case of PolarBear: it will operate at the frequencies 90, 150 and 220 GHz covering 225 deg2; the number of detectors for each frequency should be 400, 600 and 200 with a sensitivity per detector of 310, 345 and 640 μKs1/2 respectively. Considering an observational time of 1.5 yr with an efficiency of 30 per cent, the sensitivity per 1° pixel at 90 GHz would be ≃0.1 μK, an order of magnitude lower than the Planck one. We find that PolarBear will be able to provide a 2-σ detection of the tensor polarization for r≃ 0.07.
Based on the above experiments, we describe below the possible features for future missions specifically dedicated to the detection of the CMB B-mode polarization, and we compute the corresponding detectability limit on r.
5.1 Space experiment
It is interesting to know how the detectability limit on r improves when reducing the instrumental noise in the Planck experiment by the same factor at all the frequencies. Fig. 9 shows the results for rlim. In the upper line we are assuming that Galactic foregrounds are subtracted following the C1 scheme and extragalactic foregrounds are partially reduced (as discussed in Section 4.3). This is probably an upper limit. On the other hand, in the lower line extragalactic foregrounds are neglected (we consider they are completely removed), while the C2 scheme is used for the Galactic polarization subtraction. We observe that the results are independent of the two hypotheses on the foreground subtraction if the sensitivity of the Planck detectors is improved by a factor ≲30 (corresponding to rlim≳ 10−3). In this case, the instrumental noise is still the most constraining contribution. For sensitivities 100 times or more greater than the Planck one, the upper line is constant with rlim≃ 3.5 × 10⁻⁴, while the lower line still decreases reaching a rlim similar to the noise-free case for σ/σPlanck~ 10−3. We plot the tail of the lower curve as a dotted line in order to indicate that, for such high sensitivities, it must not be considered a lower limit for the detectability of r, since the uncertainty of the foreground spectral index that we used, σβ= 0.2, can be improved.
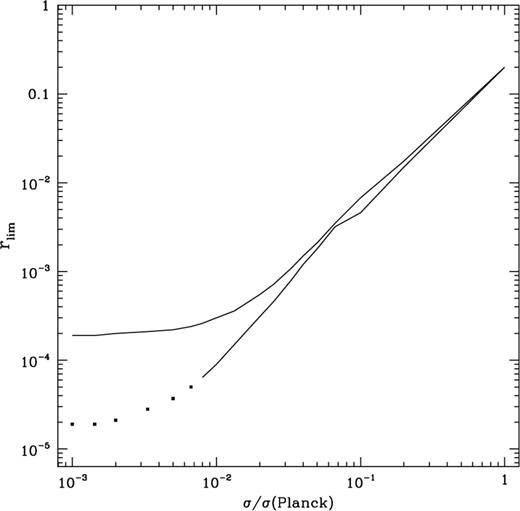
The value of rlim for an experiment like Planck, but with sensitivity improved by a factor σ/σPlanck. In the upper (lower) line Galactic foregrounds are subtracted following the C1 (C2) scheme and extragalactic foregrounds are partially (completely) removed.

We discuss now a more concrete example for a space experiment: a total of 10 000 detectors in three channels at 100, 140 and 220 GHz with the same sensitivity as the Planck detectors. With about 3000 detectors for each channel, instead of the eight present in Planck, we expect the sensitivity to increase by a factor of about 20. The 100 GHz channel is used as the observational frequency and the other two channels to remove the dust polarized contribution. A template for the synchrotron polarization is also required, as its signal is still important at 100 GHz. If the low-frequency channels of the Planck mission are considered, we find rlim≃ 2.5 × 10⁻³. In spite of the low accuracy in the synchrotron subtraction, rlim is only a factor of ~1.4 higher than the corresponding value of Fig. 9. The results are not affected by the contribution of extragalactic foregrounds (radio sources and lensing), while there is only a slight dependence on the method of the Galactic foreground subtraction.
5.2 Ground-based Bolometers
We consider the use of an array of 5000 bolometers at frequencies of 90 and 150 GHz with a sensitivity per detector of 250 μKs1/2. After one year of observations (60 per cent efficiency) over a 30°× 30° patch of the sky, we would obtain a sensitivity of 33 nK per 1-degree pixel at both frequencies. Using the 30-GHz channel5 of the Planck mission to subtract the synchrotron emission, we find rlim= 0.03. These values can be reduced by a factor of 2 if a channel at 100 GHz is chosen instead of 90 GHz. The results are practically independent of the method used to subtract Galactic foregrounds and of the contribution of extragalactic foregrounds. Reducing the area observed, the sensitivity per pixel is improved but not the sensitivity on r: for a 20°× 20° area, σ = 22 nK while rlim≃ 0.07.
5.3 Ground-based Radiometers
We assume an array of 1000 radiometers at 30 GHz and 4000 at 90 GHz. Assuming 1 yr of observations over a 30°× 30° patch with 80 per cent efficiency and a sensitivity of 120 and 200 μKs1/2 at 30 and 90 GHz respectively, we get sensitivities per square degree pixel of 31.5 nK at 30 GHz and 21 nK at 90 GHz. Using the 217-GHz channel5 of Planck for the subtraction of the dust emission, we find a 2-σ detection for r≃ 0.28. This result points out that experiments based only on radiometers, although with comparable or better sensitivity, appear to be less efficient than bolometers in detecting the tensor polarization [in other words, higher frequencies (ν ≳ 100 GHz) are better than lower ones (ν ≲ 100 GHz)]. The reason is the different spectral behaviours of dust and synchrotron emission: the frequency spectrum of synchrotron emission is very steep and already at 100 GHz its polarized contribution is small; on the contrary, the dust spectrum decreases quite slowly with the wavelength and at 70-80 GHz its polarization level is still comparable to that of the synchrotron emission.
Finally, considering jointly radiometers that operate at 30 and 70 GHz and bolometers at 100 and 150 GHz with the features previously described, we find a sensitivity to the CMB B-mode polarization similar to the one achieved by the space mission: rlim~ 6 × 10⁻³.
6 Discussions and Conclusions
In this paper we have investigated the constraints that foregrounds can impose on the detection of the B-mode polarization induced by gravitational waves. First, we carry out a detailed analysis on the expected level of the foreground polarization at 1° scales, i.e. the angular scales where the cosmological B-mode signal is concentrated. The diffuse Galactic emissions (synchrotron and dust emission) are the dominant components. The minimum of their polarized emission is found to be around 100 GHz, corresponding to a rms value for the B-mode of ~0.5 μK at 1° resolution (to be compared with the CMB  ). We expect a shift of the ‘cosmological window’ in polarization towards higher frequencies as compared to temperature fluctuations, where the lowest emissivity of foregrounds is observed around 60 GHz. This is due to the high degree of polarization of the synchrotron emission, the diffuse component of which is observed to be up to 30 per cent polarized or more. The contribution of extragalactic radio sources and of the polarization produced by gravitational lensing is secondary on large scales, but not negligible when techniques to subtract Galactic foregrounds are applied to polarization data. On the contrary, other sources of polarized emission (such as infrared galaxies, SZ effect, etc.) are expected to be negligible.
The subtraction of the Galactic contributions from polarization maps is mandatory in order to search for the gravitational wave signal. Assuming component separation boils down to subtracting, at the CMB observing frequency, a set of foreground templates scaled in frequency according to a model emission law, we provide an analytical expression for the power spectrum of the residual polarization, depending on the noise in the foreground templates and on the uncertainty in their spectral behaviour. We study two concrete cases: (i) the frequency spectrum of Galactic emissions is supposedly independent of the sky direction; (ii) the frequency spectrum is estimated pixel by pixel, but with an uncertainty that behaves like white noise. As expected, under this second hypothesis a better subtraction of Galactic foregrounds is achieved: if only the contribution of the residual Galactic foregrounds is taken into account, we find that a 3-σ detection of the tensor polarization is possible for r~ 10−5, corresponding to an energy of inflation of ~ 2 × 10¹⁵ GeV. However, this value should not be considered as a lower limit for the detectability of the primordial B-mode polarization since it arises from a working hypothesis. In fact, in this case, the amplitude of the residual Galactic APS depends on the average uncertainty with which the spectral index is computed. We have taken σβ= 0.2: this value is probably reliable for the data available up to now, but it will be improved in the future. In this sense, a limit on the detectability of the CMB B-mode polarization cannot be put a priori. Opposite conclusions are found if the subtraction of Galactic foregrounds is based on the assumption that their spectral law is independent of the sky direction. At present the amplitude of the residual Galactic foregrounds depends on the intrinsic dispersion of the spectral law in the sky (σβ= 0.2) and not on our ability to estimate it. So the value of r≃ 10−4 that we find for a 3-σ detection corresponds to the lower limit for the detectability of the gravitational wave polarization in this case.
Clearly then, taking into account the spectral variability of foregrounds in the component separation is a key point in order to detect cosmological CMB B-mode polarization for very low r. At the present time, only a few methods have been proposed to perform the component separation, with spatial variability of foregrounds (Stolyarov et al. 2004; Bennett et al. 2003) showing promising results. More efforts within this field are still required.
The effects of extragalactic radio sources and gravitational lensing on the r sensitivity are also studied. After subtraction of the Galactic foregrounds, they become the major contaminant on large scales. In principle, CMB experiments with high resolution can accurately control these foregrounds. Lensing and radio sources are much more problematic for measurements with a wide beam, and complementary data with high resolution are required in order to reduce their polarized contribution. We have seen that, for a full-sky ‘noise-free’ experiment with 1° resolution, a reduction by a factor of 10 for the B-mode APS of radio sources and lensing is probably feasible, giving a detectability limit of r~ 10−4 independent of the method of subtracting Galactic foregrounds. This value is, in any case, better than those found by experiments covering only a small area of the sky, that are strongly limited by the cosmic variance.
Finally, we have discussed the prospects, ‘in practice’, for the detection of tensor polarization in the future. In the short term, a tensor-to-scalar ratio of r~ 0.05 is well within reach of the Planck mission and planned ground-based experiments. A detection of tensor modes with high values of r would be an indication of an inflation driven by some exotic physics (Kinney 2003). The next generation of missions, which are at the moment under discussion by NASA and ESA, will be able to significantly improve the sensitivity to polarized emission by means of arrays of 103−104 detectors, and will probably allow us to investigate more conventional theories of inflation, spanning ranges of energy down to ~5 × 10¹⁵ GeV.
Acknowledgments
MT and EMG gratefully acknowledge the financial support provided through the European Community's Human Potential Programme under contract HPRN-CT-2000-00124, CMBNET, and through the Spanish Ministerio de Ciencia y Tecnologia, reference ESP2002-04141-C03-01. EMG, PV and JD want to thank the joint Spain-France project Acción Integrada HF03-163, Programmes d'Actions Intégrées (Picasso) for financial support.
References
The tensor-to-scalar ratio is often defined also in terms of the primordial amplitude of tensor and scalar fluctuations (Leach et al. 2002). For the ‘concordance’ model, it corresponds to 1.78Q2T/Q2S.
Hereafter we have assumed that, on average, the amplitude of E- and B-mode polarization is the same with regard to foreground emission.
In this case, the residual polarization arises mostly from the noise in the template map, rather than from the uncertainty on the spectral index. Therefore foreground templates at frequencies distant from the observational one are preferred.
Appendices
Appendix A: Estimate of the Residual Power Spectrum
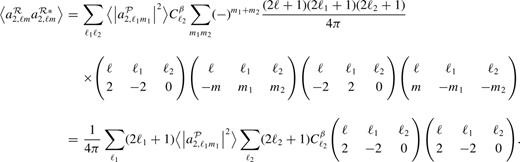
In this appendix we demonstrate the result given in equation (9). In particular, we want to calculate the E- and B-mode power spectrum for the function  , where
 is a spin-2 function [in equation (9) it is the linear combination of Stokes parameters Q±iU] and β is a real scalar function (i.e. the error on the spectral index)
 and
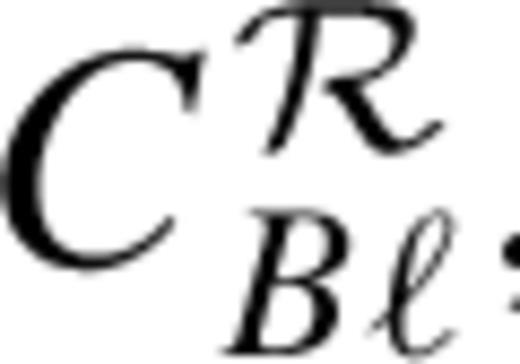
 . According to Zaldarriaga & Seljak (1997) formalism, the B-mode power spectrum is

 , we start by considering the first term in the right hand of equation (A1)
 and
 , and removing from integrals all the terms independent of the sky position, we find

 and
 , we obtain