Abstract
We report the discovery of emission features in the X-ray spectrum of GRO J1655−40 obtained with RXTE during the observation of 1997 February 26. We have fitted the features first by two Gaussian lines which in four spectra analysed have average energies of 5.85±0.08 and 7.32±0.13 keV, strongly suggestive that these are the red- and blueshifted wings of an iron disc line. These energies imply a velocity of ∼0.33c. The blue wing is less bright than in the calculated profiles of disc lines near a black hole subject to Doppler boosting; however, known Fe absorption lines in GRO J1655−40 at energies between ∼7 and 8 keV can reduce the apparent brightness of the blue wing. Secondly, we have fitted the spectra using the disc line model of Laor based on a full relativistic treatment plus an absorption line, and show that good fits are obtained. This gives a rest-frame energy of the disc line between 6.4 and 6.8 keV, indicating that the line is iron Kα emission probably of significantly ionized material. The Laor model shows that the line originates in a region of the accretion disc extending from ∼10 Schwarzschild radii from the black hole outwards. The line is direct evidence for the black hole nature of the compact object, and is the first discovery of a highly red- and blueshifted iron disc line in a Galactic source.
Introduction
The X-ray nova GRO J1655−40 discovered with BATSE (Zhang et al. 1994) is one of the only two definite Galactic superluminal jet sources: GRO J1655−40 and GRS 1915+105 (Mirabel & Rodriguez 1994). These two sources are also transient, whereas the source SS 433 with a velocity in the jets of 0.26c is persistent. Radio images of the source showed condensations moving in opposite directions (Tingay et al. 1995). The apparent superluminal motion implies that the emitting plasma has velocity close to c, in fact 0.92c (Hjellming & Rupen 1995). Initially, X-ray outbursts were separated by ∼120 d (Zhang et al. 1995), and on 1996 April 25 an outburst began which lasted 16 months, as shown by the RXTE All-Sky Monitor (ASM) (Sobczak et al. 1999). By the time of this outburst, the strong radio activity had ceased, although radio emission was detected again on 1996 May 29 (Hunstead & Campbell-Wilson 1996). Lack of radio detection after that date, despite regular monitoring (Tingay, private communication), implies that the jets had ceased to exist.
The optical observation of 1996 March provided a mass of the central objects of 7.02±0.22 M⊙ and an inclination angle of 69 (Orosz & Bailyn 1997). An inclination of 63
 7–70
7–70 7 was found by van der Hooft et al. (1998). GRO J1655−40 is thus generally accepted to be a black hole binary, the only Galactic jet source with mass determination evidence for its black hole nature.
Several observations were made with ASCA, the first on 1994 August 23; on 1997 February 26–28 an observation lasting one orbital cycle was made during which the RXTE observation discussed here was also carried out. Iron absorption-line features were found at ∼6.6 and ∼7.7 keV when the source was less bright (0.27–0.57 crab), and at ∼7 and ∼8 keV when the source was brighter (2.2 crab), and these were identified with Kα and Kβ lines of helium-like and hydrogen-like iron respectively. In the observation of 1997 February 26–28, a broad absorption feature at ∼6.8 keV was seen, thought to be a blend of He-like and H-like lines (Yamaoka et al., in preparation). Sobczak et al. (1999) found evidence for an iron edge at 8 keV. X-ray dipping has been observed in GRO J1655−40, and many short and deep dips similar to the those in Cygnus X-1 (Balucinska-Church et al. 2000) are seen.
Analysis and results
The observation of GRO J1655−40 analysed here took place on 1997 February 26, lasting 14 600 s, and had an exposure of 7.6 ks. Data from the Proportional Counter Array (PCA) instruments in ‘Standard 2’ mode are presented. Data were screened by selecting for angular distance less than 0 02. The PCA consists of five Proportional Counting Units (PCUs 0–4); spectra were extracted for each PCU separately but only units 0, 1 and 4 were used because of the consistently higher values of χ2 found in fitting data on the Crab Nebula with PCUs 2 and 3 (Sobczak et al. 1999). Fig. 1 shows the light curve from all five PCUs of the PCA with a binning of 16 s. Strong dipping is seen at 8.5 ks. Four spectra were selected at different times during the observation, avoiding the dips; these are indicated by arrows in Fig. 1, and are labelled spectrum 1 to spectrum 4. The third of these (at ∼9 ks) follows a dip, and may have slightly reduced intensity. Three further spectra (not presented) gave similar results.
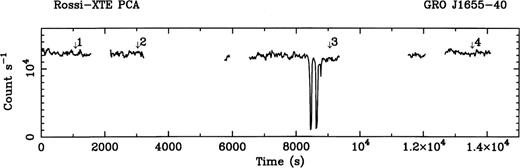
PCA light curve in the energy band 2–30 keV with 16-s binning after deadtime correction.

Spectra were accumulated over times averaging 140 s, equivalent to ∼340 000 counts per spectrum. Data were used between 3.5 and 25 keV. Primitive channels were regrouped in twos between channels 30 and 39 (13–16 keV) and in fours above channel 40, and systematic errors of 1 per cent added. Background subtraction was carried out using standard background models, and instrument responses from 1998 November 28 were used. Spectra from each time interval were extracted for PCUs 0, 1 and 4, and these were fitted simultaneously with a variable normalization allowed between the PCUs in the fitting. A number of spectral models were investigated. Simple one-component models were not able to fit the spectra, and a good fit to the continuum was obtained with a two-component model consisting of a disc blackbody plus a power-law component. The luminosity (0.1–100 keV) was 9.7×1037 erg s−1, with the disc blackbody constituting 89 per cent of the total and the power law constituting 11 per cent.
For the continuum-only model, however, the χ2 per degree of freedom (dof) was poor, typically 130/91, and positive residuals could be seen in the spectra as shown in the example of Fig. 2 (spectrum 3); these data are replotted in the form of ratios of the data to the best-fitting model for each of the four data sets in Fig. 3. Strong line features at ∼5.8 and ∼7.3 keV can be seen in all of the spectra. Note that, in the ratio plots, the lower energy part of the line is reduced compared with the higher energy part because of the decreasing continuum, so that the line centre appears to be at higher energy than its true value shown in the residual plots. The four spectra were refitted with two Gaussian lines added to the model. There was a marked improvement in the quality of fit, with an average value of χ2/dof of 70/85. Results for all four spectra are shown in Table 1, where values of χ2 are compared with values for the continuum model alone. F-tests showed that the addition of two lines was significant at ≫99.9 per cent confidence. Fig. 4 shows the spectrum of Fig. 2 with two lines added to the model. Equivalent widths (EW) were derived for each Gaussian component, treating the red and blue wings as separate lines and the red wing had a mean EW of 70 eV and the blue wing a mean EW of 160 eV.
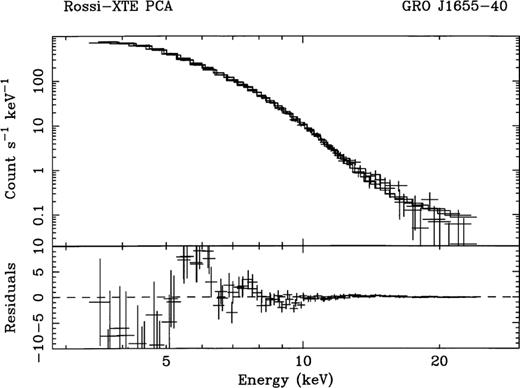
Spectrum of a single data set with residuals; data from PCUs 0, 1 and 4 are shown, and were fitted simultaneously.

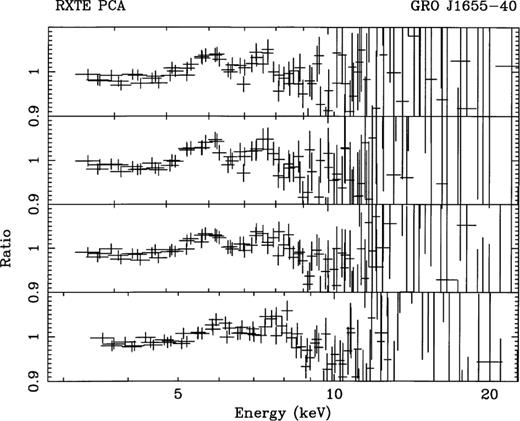
Ratios of the data to the models for the four spectra indicated in Fig. 1. The lowest panel shows spectrum 1.

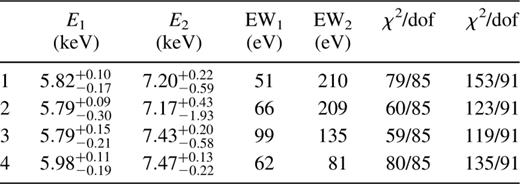
Line parameters from the best-fitting results for spectra 1–4 using a model consisting of a disc blackbody+power law+two Gaussian lines. χ2 values are also shown for the best continuum fits without emission lines (right-hand column).

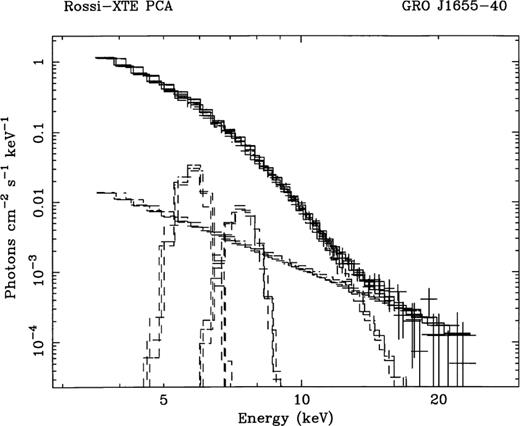
Unfolded spectrum of the best fit to spectrum 3, including two Gaussian lines.

Absorption features can also be seen in the spectra, for example, at ∼8.9 keV in spectrum 1 (lowest panel). This feature can be seen in all 4 spectra, and there is some evidence for small changes in its energy. Spectrum 3 also apparently has an absorption line or edge at 8.2 keV, and this may be indicative that the data are not completely out of the dip. To investigate this point further, dip spectra were examined in relatively shallow dipping in which the spectrum is not modified in a major way by absorption. A spectrum was selected in the intensity band 6100–6900 count s−1 from Fig. 1 and the continuum fitted with an appropriate model with partial covering of the disc blackbody plus power law. In this case, the ratio plot showed an even stronger depression at ∼8 keV than that of spectrum 3 in Fig. 3.
Although we have detected clear absorption features in the spectra, we can also ask whether the spectra may be modelled by addition of a postulated, but undetected, absorption feature at an energy between the red and blue emission peaks: i.e. by modelling the valley between the emission peaks without requiring there to be emission. The continuum-only model leaves positive residuals at ∼5.8 and ∼7.3 keV, as can be seen in Figs 2 and 3. Since the continuum is well fitted (as shown by the χ2/dof for the best-fitting models), these positive residuals are in no way model-dependent, and so are strong evidence for the disc line. Thus it is impossible for the positive residuals to be removed by adding an absorption line. It is confirmed by spectral fitting tests that the positive residuals cannot be removed in this way.
Fitting the spectra with two emission lines was the obvious way of investigating the energies of the emission features. The fact that the feature energies are consistent with red- and blueshifted iron disc line emission is strong evidence that the features are iron disc line emission (the radio jets having ceased to exist), and makes it unlikely that these features are coincidentally at these energies and have another origin. The intensity of the blue wing of a disc line is, however, expected to be higher than that of the red wing (Fabian et al. 1989; Laor 1991), whereas we find the blue wing intensity to be generally rather less than that of the red wing. The absorption features detected by ASCA and in the present work at energies above 6.6 keV can modify the observed broad disc line considerably, and we require absorption at about the energy of the blue wing for our results to be consistent with a disc line. Consequently, we have carried out fitting with a model containg the Laor disc line model in xspec added to the disc blackbody plus power law continuum components, plus an absorption line. Stable, free-fitting results were obtained for all four spectra with this model, and the results are shown in Table 2. Values of the rest-frame energy varied between 6.4 and 6.8 keV with a mean of 6.56 keV. The energy of the absorption line was well constrained, since a large residual at a well-defined energy would result from the blue wing of the Laor model if the absorption line were omitted. Line energies varied between 7.0 and 7.3 keV. χ2/dof values were similar to those obtained with two emission lines, varying between 60/84 and 87/84. The inner radius of the disc line emission region r1 was found to be ∼10rS(rS is the Schwarzschild radius); r2 was ≳50rS, but was poorly constrained. We have thus shown that it is possible to fit the spectra with a model based on the assumption that the blue disc line wing appears relatively weak because of absorption at ∼7 keV. It can be argued that the Laor model is preferred because it contains the correct line shape and the model with two emission lines does not. On the other hand, the two-emission-line model is better able to determine red and blue energies as there is no complicating extra absorption component in the model. However, the line energies must be interpreted as an average over the inner disc. Finally, we note that we do not require absorption at exactly the energies derived above to reduce the observed flux of the blue wing; we are not attempting to fit all of the absorption features in the spectrum, and various absorption features at 7–8 keV would be capable of reducing the blue wing flux.
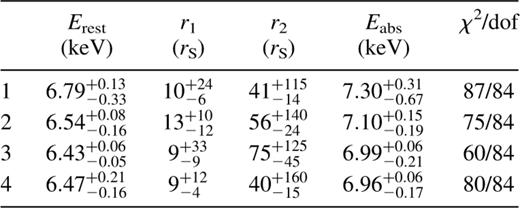
Best-fitting results for spectra 1–4 using a model consisting of a disc blackbody + power law + Laor disc line + absorption line.

Finally, we have tested whether a reflection component can be detected in GRO 1655−40, i.e. a component spectrally different from the incident power law (see Ross, Fabian & Young 1999). To do this, we added the ‘pexriv’ component in xspec to our best-fitting models (Magdziarz & Zdziarski 1995), although this model may be inaccurate for high values of ξ (Ross et al. 1999). This was done for the two-emission-line models and for the Laor disc line plus absorption line models. Our results for the disc-line energies and for the absorption line indicate an ionized medium, and so we have allowed the ionization parameter ξ in the reflection model to vary between 500 and 104. The reflection component normalization and power-law index were chained to the values of the power law. We note, however, that without the reflection component, for both the two-emission-line and Laor model fitting, χ2/dof was already acceptable. Fitting with a reflection component added showed that there was no reduction in χ2. The upper limit flux of the ‘pexriv’ reflection component was 1 per cent of the total flux at 7 keV. For ξ<104, the actual contribution of a reflection component would be less than 1 per cent. We thus conclude that we have not detected a reflection component. If a reflection component existed at a flux level of ≲1 per cent, it would not be possible for the edge in this component to modify in any significant way the values that we have derived for red and blue wing energies, widths and equivalent widths. In this source the blackbody strongly dominates the spectrum with 90 per cent of the luminosity (see Fig. 5), unlike in Cygnus X-1 in the low state (e.g. Balucinska-Church et al. 1995) where the power law strongly dominates. The reflection component in ‘pexriv’ is a fraction of the underlying power law of the order of 10 per cent, and thus we expect the contribution of a reflection component to be small.
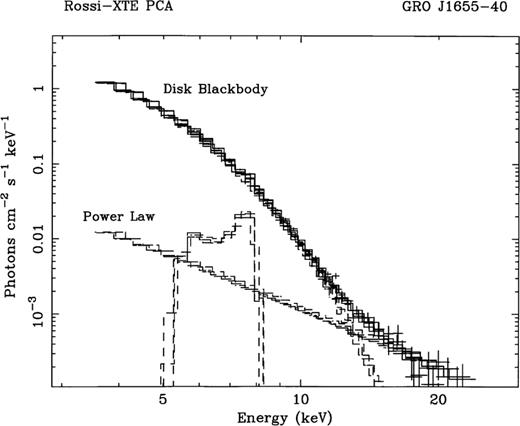
Best-fitting Laor disc line+absorption line model for spectrum 1. The disc blackbody, power-law and Laor components are shown. The absorption line cannot be plotted as it has negative normalization. The strong dominance of the blackbody emission can be seen.

Discussion
We have presented evidence for a broad emission feature in the X-ray spectrum of GRO J1655−40, having red and blue wings which we have modelled by two Gaussian lines and also by using the Laor model plus an absorption line. Using the first model, the line components have high significance as shown by F-tests, and the average line energies obtained by fitting two emission lines from all four data sets analysed are 5.85±0.08 and 7.32±0.13 keV. Given the inability to fit the spectra without emission lines, and given these line energies, it is likely that the emission is iron emission. From the fact that radio emission was switched off before the observation discussed, the lines almost certainly originate in the disc.
We have also fitted the spectra with a model consisting of continuum components plus a Laor disc line plus an absorption line, and conclude that a blue wing intensity less than expected can be explained by absorption at ∼7 keV reducing the observed flux of the blue wing. This can be either iron Kα or Kβ absorption. The results for this model give somewhat smaller rest-frame energies than derived from the two-emission-line model, the mean value being 6.56±0.14 keV compared with 6.88±0.12 keV.
First, we will compare our results with those obtained using ASCA. In the observations of 1994–96, the energies at which iron absorption lines were detected were ∼6.6 and ∼7.7 keV for the source at low intensity, and ∼7 and ∼8 keV when brighter (Ueda et al. 1998). In the RXTE data, however, we see evidence for an absorption feature at ∼9 keV and for an absorption feature at 8 keV in spectrum 3. In the ASCA observation made on 1997 February 26–28 which included the RXTE observation, the total spectrum containing all data showed broad absorption at 6.7 keV, thought to be a blend of He-like and H-like iron Kα lines (Yamaoka et al., in preparation). This energy corresponds approximately to the position of the neck between the red and blue peaks that we detect. The ASCA spectra do show some evidence for emission, however (i.e positive residuals), particularly when the source is not very bright (fig. 3 of Ueda et al. 1998). It is not clear at this stage why emission features were not seen more clearly in ASCA; one possibility is that the emission may vary with time, and the ASCA spectra were integrated over relatively long periods leading to smearing of the emission.
Using our results from fitting two emission lines, the relativistic Doppler formula can be used with the mean energies of the red and blue wings E1=5.85 keV and E2=7.32 keV to solve for the velocity βvc and the rest-frame energy of the disc line. This gives a mean rest-frame energy of 6.88±0.12 keV and a mean β=0.33±0.02 for an inclination angle of 70°. The mean of E1 and E2 has an average value of 6.58±0.10 keV over the four spectra, so that the redshift is 0.3 keV, i.e. z=0.046. This is partly gravitational redshift and partly the transverse Doppler effect. A gravitational redshift of 0.046 would be produced by emission at ∼12rS.
Results from the Laor model give a mean rest-frame energy of 6.56±0.14 keV. We conclude that the rest-frame energy is between 6.4 and 7.0 keV, indicating Fe Kα emission. The exact ionization state is not clear: the mean of 6.56 keV implies Fe xxii. The Laor model fitting further provides the inner and outer radii of the disc line emission region: r1∼10rS and r2≳50rS. It may be thought that emission from different radii would tend to smear out the wings; however, simulations show that this does not take place for emission between 10rS and 100rS, or even for emission between 10rS and 200rS. The inner radius of the emission region is more important, and if we allow emission from 1rS to 10rS there is smearing out because of the strong emission from inner radii and changing energy shifts. However, it is likely that the disc inside 10rS is totally ionized by X-ray emission, so that no lines are produced and large-scale smearing out does not occur.
The ASCA observation of 1997 February, spanning one orbital cycle, detected an absorption line at ∼6.8 keV at all orbital phases, showing that the absorbing material was not confined to part of the accretion disc structure (Yamaoka et al., in preparation) as in low-mass X-ray binaries. Moreover, the line energies seen generally by ASCA were H-like or He-like, showing that the absorbing plasma was highly ionized. Our observation of highly broadened iron emission clearly shows the line to originate in the inner, highly ionized, disc. The location of the absorber is, however, not so clear.
Further observation and detailed analysis are clearly needed to explain the observed spectral features which are complex (the absorption features in particular), appearing to change with source intensity. GRO J1655−40 offers probably the best opportunity of studying disc lines strongly affected by gravitational and Doppler effects because of the high inclination at which it is seen. Our detection of the red- and blueshifted wings at energies of 5.8 and 7.3 keV is direct evidence for the black hole, since a splitting as wide as this cannot be produced by a neutron star, and it is the first detection of a red- and blueshifted disc line in a Galactic source.
Acknowledgments
We thank Professor Hajime Inoue for valuable discussions on the relationship between the emission features reported here and absorption features discovered with ASCA.
References