Abstract
We constrain cosmological parameters using combined measurements of the baryon acoustic oscillation (BAO) feature in the correlation function of galaxies and Lyα absorbers that together cover 0.1 < z < 2.4. The BAO position measurements alone – without fixing the absolute sound horizon ‘standard ruler’ length with cosmic microwave background (CMB) data – constrain Ωm = 0.303 ± 0.040 (68 per cent confidence) for a flat Λ cold dark matter (ΛCDM) model, and |$w=-1.06^{+0.33}_{-0.32}$|, |$\Omega _{\rm m}=0.292^{+0.045}_{-0.040}$| for a flat wCDM model. Adding other large-scale structure (LSS) clustering constraints – correlation function shape, the Alcock–Paczynski test and growth rate information – to the BAO considerably tightens constraints (Ωm = 0.290 ± 0.019, H0 = 67.5 ± 2.8 km s−1 Mpc−1, σ8 = 0.80 ± 0.05 for ΛCDM, and w = −1.14 ± 0.19 for wCDM). The LSS data mildly prefer a lower value of H0, and a higher value of Ωm, than local distance ladder and Type IA supernovae (SNe) measurements, respectively. While tension in the combined CMB, SNe and distance ladder data appear to be relieved by allowing w < −1, this freedom introduces tension with the LSS σ8 constraint from the growth rate of matter fluctuations. The combined constraint on w from CMB, BAO and LSS clustering for a flat wCDM model is w = −1.03 ± 0.06.
1 INTRODUCTION
Recent measurements of temperature anisotropy in the cosmic microwave background (CMB) continue to strongly support the standard Λ cold dark matter (ΛCDM) cosmological model, and now constrain its parameters to 1 or 2 per cent (e.g. Hinshaw et al. 2012; Story et al. 2012; Planck Collaboration XVI 2013; Sievers et al. 2013). While upcoming polarization data may yield insight into the physics of the early universe, with the recent release of Planck cosmology results, future improvements in ΛCDM constraints from the CMB will be modest. In the coming years, the precision of low-redshift cosmological constraints will significantly increase relative to those from the CMB, predominantly due to intensive efforts to constrain the evolution of dark energy (DE; e.g. Albrecht et al. 2006; Weinberg et al. 2012).
One powerful low-redshift probe is the measurement of position of the baryon acoustic oscillation (BAO) feature in the correlation function of large-scale structure (LSS), the imprint of sound waves in the pre-recombination plasma. The BAO measurements are one of the few low-redshift cosmological probes that are limited by statistical, rather than systematic, uncertainties (e.g. Weinberg et al. 2012, and references therein).
The BAO scale observed in LSS correlations is intimately related to the photon acoustic scale measured with high precision in the CMB fluctuations (Eisenstein, Hu & Tegmark 1998). Typically, BAO constraints are discussed, and compared with other low-redshift measurements, using CMB data to fix or tightly constrain portions of parameter space. In this work, we consider an alternative approach, and examine cosmological constraints from the latest BAO (and associated LSS clustering) measurements without strong CMB-based priors.
CMB and low-redshift measurements are subject to different observational issues and challenges, and affected differently by, for instance, any non-standard early-universe physics or late-time expansion. A hypothetical deviation from Λ-acceleration may first appear as a tension between CMB and low-redshift data, or between different low-redshift probes. Such tension in general could also arise from statistical fluctuations, systematic uncertainties that are incorrectly quantified, alternative extensions to the standard model, or some combination of these factors. The ability to disambiguate these possibilities is crucial if we are to get the most out of data from current and future low-redshift experiments. Already, mild tensions have been reported between BAO and local distance ladder measurements of H0 in the context of a ΛCDM model, when analysed in conjunction with CMB data (e.g. Anderson et al. 2012; Hou et al. 2012; Planck Collaboration XVI 2013). We will show that there is now evidence for mild BAO–distance ladder tension even without calibrating the BAO measurements using the CMB constraint on the acoustic scale. Similarly, current BAO and LSS precision is now sufficient to permit a meaningful comparison with Type IA supernovae (SNe) measurements of the low-redshift expansion rate without strong CMB priors. We show that the BAO and LSS data mildly prefer a higher matter density, Ωm, than a recent SNe compilation.
The ΛCDM tensions between the CMB and distance ladder or SNe measurements reported by Planck (Planck Collaboration XVI 2013) are both effectively relieved by allowing the DE equation of state w < −1. We will show, however, that reducing w below −1 introduces some tension with the amplitude of matter fluctuations, σ8, measured using growth rate constraints from redshift-space distortions.
We anticipate that comparing results from different low-redshift probes, both together, and separately from, CMB constraints, will prove increasingly useful as data precision continue to improve.
In Section 2 we discuss the physical information provided by BAO measurements; Section 3 deals with our choice of data and fitting methodology; results are presented in Section 4 and a discussion and conclusions follow in Sections 5 and 6.
2 COSMOLOGY FROM THE BARYON ACOUSTIC OSCILLATION SCALE
The large size of the sound horizon, approximately 150 comoving Mpc, means the BAO feature remains identifiable in low-redshift LSS despite the effects of non-linear growth of structure (e.g. Tegmark 1997; Eisenstein, Seo & White 2007a), however, the contrast of the feature is fairly low, essentially because baryons represent a small fraction of the total matter density. Measuring BAO therefore requires surveys that sample large cosmological volumes. The BAO feature in the galaxy correlation function was first detected by the Sloan Digital Sky Survey (SDSS; Eisenstein et al. 2005) and Two-degree Field Galaxy Redshift Survey (2dFGRS; Cole et al. 2005), and has subsequently also been measured using galaxy samples over 0 < z < 1 by the Six-degree Field Galaxy Survey (6dFGS; Beutler et al. 2011), the WiggleZ Dark Energy Survey (Blake et al. 2011b) and the Baryon Oscillation Spectroscopic Survey (BOSS; Anderson et al. 2012).
Jointly considering the transverse and radial Lyα constraints somewhat tightens constraints but does not impact qualitatively on our conclusions. Future Lyα data may warrant a more detailed approach than we consider here.
2.1 Constraints from BAO position alone
Measurements of the BAO scale are sensitive to the low-redshift expansion rate through DA and H(z), and so constrain Ωm (with ΩΛ determined implicitly in a flat ΛCDM model). A joint fit to BAO data over a range of redshift also constrains an overall normalization that in this work we will express as the combination H0 rs. Going beyond the standard model, BAO measurements alone also constrain parameters that modify the low-redshift expansion rate, such as w. BAO-only constraints on Ωm and w can be directly compared with those from, for instance, Type IA SNe, without requiring an external constraint on the absolute ‘standard ruler’ scale rs from CMB anisotropy. This comparison is now becoming meaningful owing to the addition of the high-redshift Lyα BAO constraint to existing z < 1 BAO measurements.
It should be noted that we view the wCDM fits in this work as a mathematical exercise in expansion history parametrization – something like a ΛCDM null-test – and do not present or discuss any particular physical model that could give rise to w ≠ −1. We also do not investigate allowing additional freedom in w, for instance through the popular w0 − wa parametrization (Chevallier & Polarski 2001; Linder 2003), since BAO measurements alone do not (yet) usefully constrain such additional parameters.
2.2 Additional constraints from LSS clustering
The clustering of LSS tracers contains cosmological constraints beyond simply the position of the BAO feature, although extracting this information typically requires somewhat stronger assumptions regarding the bias of the tracers or the underlying shape of the matter power spectrum. We here briefly review the additional constraints that we incorporate in the second stage of our analysis.
Marginalizing over uncertainties in bias, one can use the entire measured power spectrum as a standard ruler, rather than just the BAO position feature (e.g. Eisenstein et al. 2005; Sánchez, Baugh & Angulo 2008; Shoji, Jeong & Komatsu 2009). Blake et al. (2011b) used this approach to constrain the parameter |$A_{\rm s}=100D_{\rm V}\sqrt{\Omega _{\rm m}h^2}/cz$| from the overall power spectrum shape measured from WiggleZ. An additional constraint can be obtained by matching the transverse and radial clustering shapes (i.e. by enforcing statistical isotropy) – known as the Alcock–Paczynski (AP) test (Alcock & Paczynski 1979). This constrains the product of DA and H, which can be expressed as, for example, F(z) = (1 + z)DA(z)H(z)/c. It is important to account for anisotropy from redshift-space distortion due to LSS tracer peculiar velocity (Kaiser 1987) when applying the AP test (Ballinger, Peacock & Heavens 1996). Provided non-linearities can be robustly treated, the inclusion of redshift-space power spectrum data constrains f(z)σ8(z), where f = d ln δ/d ln a is the linear growth rate, and σ8(z) = σ8[δ(z)/δ(0)], where σ8 is the rms linear mass fluctuations in spheres of radius 8 h−1 Mpc at redshift zero.
The constraints on Ωmh2 from the shape of the galaxy power spectrum (e.g. Eisenstein et al. 2005; Reid et al. 2010; Chuang & Wang 2013; Chuang et al. 2013) mean H0 and rs can be separately constrained. This is a powerful and useful feature because it allows constraints on H0 from LSS clustering to be compared to other more direct H0 measurements for a given cosmological model (Section 5.1). Similarly, the joint constraints on Ωm and σ8 can be compared with weak lensing and cluster counting analyses (Section 5.3).
3 DATA AND MODEL FITTING
The BAO data used in our analysis are listed in Table 1. We opt to use recent analyses of the SDSS Data Release 7 (DR7) and BOSS DR9 CMASS samples that constrain the BAO position in both the radial and transverse directions (Anderson et al. 2013; Xu et al. 2013). We also use SDSS and CMASS constraints from analyses that attempt reconstruction of the linear density field (Eisenstein et al. 2007b). Earlier results (e.g. Eisenstein et al. 2005; Percival et al. 2010) are in good agreement with these newer analyses.
Measurements of BAO position and LSS clustering used in this analysis. The LSS clustering measurements include constraints on the acoustic parameter, As, the AP parameter, F, and the growth rate, fσ8, as defined in Section 2. Note that, while some BAO constraints are included in the LSS data set, the BAO-only data are not a subset of the LSS data (see Section 4.1). Cosmological constraints from the BAO and LSS data are discussed in Sections 4 and 5.
| Label | Survey | zeff | Constraint | Reference |
|---|---|---|---|---|
| BAO-only | 6dFGS | 0.106 | rs/DV = 0.336 ± 0.015 | Beutler et al. (2011) |
| SDSS, DR7a | 0.35 | DA/rs = 6.875 ± 0.246 | Xu et al. (2013) | |
| 0.35 | Hrs = (12 895 ± 1070) km s−1 | |||
| WiggleZb | 0.44 | rs/DV = 0.0916 ± 0.0071 | Blake et al. (2011b) | |
| 0.60 | rs/DV = 0.0726 ± 0.0034 | |||
| 0.73 | rs/DV = 0.0592 ± 0.0032 | |||
| BOSS, DR9 CMASSc | 0.57 | |$D_{\rm A}(r_{\rm s}^{\rm fid}/r_{\rm s})=(1408\pm 45)$| Mpc | Anderson et al. (2013) | |
| 0.57 | |$H(r_{\rm s}/r_{\rm s}^{\rm fid})=(92.9\pm 7.8)$| km s−1 Mpc−1 | |||
| BOSS, Lyα forestd | 2.4 | αr; see text | Slosar et al. (2013) | |
| LSS | 6dFGS | 0.106 | rs/DV = 0.336 ± 0.015 | Beutler et al. (2011) |
| SDSS, DR7a | 0.35 | DA/rs = 6.875 ± 0.246 | Xu et al. (2013) | |
| 0.35 | Hrs = (12 895 ± 1070) km s−1 | |||
| WiggleZb | 0.44 | As = 0.474 ± 0.034 | Blake et al. (2012) | |
| 0.60 | As = 0.442 ± 0.020 | |||
| 0.73 | As = 0.424 ± 0.021 | |||
| 0.44 | F = 0.482 ± 0.049 | |||
| 0.60 | F = 0.650 ± 0.053 | |||
| 0.73 | F = 0.865 ± 0.073 | |||
| 0.44 | fσ8 = 0.413 ± 0.080 | |||
| 0.60 | fσ8 = 0.390 ± 0.063 | |||
| 0.73 | fσ8 = 0.437 ± 0.072 | |||
| BOSS, DR9 CMASSe | 0.57 | H = (87.6 ± 7.2) km s−1 Mpc−1 | Chuang et al. (2013) | |
| 0.57 | DA = (1396 ± 74) Mpc | |||
| 0.57 | Ωmh2 = 0.126 ± 0.019 | |||
| 0.57 | fσ8 = 0.428 ± 0.069 | |||
| BOSS, Lyα forestd | 2.4 | αr; see text | Slosar et al. (2013) |
| Label | Survey | zeff | Constraint | Reference |
|---|---|---|---|---|
| BAO-only | 6dFGS | 0.106 | rs/DV = 0.336 ± 0.015 | Beutler et al. (2011) |
| SDSS, DR7a | 0.35 | DA/rs = 6.875 ± 0.246 | Xu et al. (2013) | |
| 0.35 | Hrs = (12 895 ± 1070) km s−1 | |||
| WiggleZb | 0.44 | rs/DV = 0.0916 ± 0.0071 | Blake et al. (2011b) | |
| 0.60 | rs/DV = 0.0726 ± 0.0034 | |||
| 0.73 | rs/DV = 0.0592 ± 0.0032 | |||
| BOSS, DR9 CMASSc | 0.57 | |$D_{\rm A}(r_{\rm s}^{\rm fid}/r_{\rm s})=(1408\pm 45)$| Mpc | Anderson et al. (2013) | |
| 0.57 | |$H(r_{\rm s}/r_{\rm s}^{\rm fid})=(92.9\pm 7.8)$| km s−1 Mpc−1 | |||
| BOSS, Lyα forestd | 2.4 | αr; see text | Slosar et al. (2013) | |
| LSS | 6dFGS | 0.106 | rs/DV = 0.336 ± 0.015 | Beutler et al. (2011) |
| SDSS, DR7a | 0.35 | DA/rs = 6.875 ± 0.246 | Xu et al. (2013) | |
| 0.35 | Hrs = (12 895 ± 1070) km s−1 | |||
| WiggleZb | 0.44 | As = 0.474 ± 0.034 | Blake et al. (2012) | |
| 0.60 | As = 0.442 ± 0.020 | |||
| 0.73 | As = 0.424 ± 0.021 | |||
| 0.44 | F = 0.482 ± 0.049 | |||
| 0.60 | F = 0.650 ± 0.053 | |||
| 0.73 | F = 0.865 ± 0.073 | |||
| 0.44 | fσ8 = 0.413 ± 0.080 | |||
| 0.60 | fσ8 = 0.390 ± 0.063 | |||
| 0.73 | fσ8 = 0.437 ± 0.072 | |||
| BOSS, DR9 CMASSe | 0.57 | H = (87.6 ± 7.2) km s−1 Mpc−1 | Chuang et al. (2013) | |
| 0.57 | DA = (1396 ± 74) Mpc | |||
| 0.57 | Ωmh2 = 0.126 ± 0.019 | |||
| 0.57 | fσ8 = 0.428 ± 0.069 | |||
| BOSS, Lyα forestd | 2.4 | αr; see text | Slosar et al. (2013) |
aThe SDSS DR7 post-reconstruction measurements of DA/rs and Hrs are correlated with correlation coefficient 0.57.
bThe covariance matrix for the WiggleZ measurements is given in equation (4) of Hinshaw et al. (2012) for DV/rs and table 2 of Blake et al. (2012) for As, F and fσ8.
cThe BOSS DR9 CMASS sample post-reconstruction measurements of |$D_{\rm A}(r_{\rm s}/r_{\rm s}^{\rm fid})$| and |$H(r_{\rm s}/r_{\rm s}^{\rm fid})$| are correlated with correlation coefficient 0.55; the fiducial sound horizon, |$r_{\rm s}^{\rm fid}$|, adopted by Anderson et al. (2013) is |$r_{\rm s}^{\rm fid}=153.19$| Mpc.
dThe fiducial value of H rs (equation 3) adopted for the BOSS Lyα analysis is 3.62 × 10⁴ km s−1.
eThe covariance matrix between parameters in the full BOSS CMASS clustering analysis is given in equation (26) of Chuang et al. (2013).
Measurements of BAO position and LSS clustering used in this analysis. The LSS clustering measurements include constraints on the acoustic parameter, As, the AP parameter, F, and the growth rate, fσ8, as defined in Section 2. Note that, while some BAO constraints are included in the LSS data set, the BAO-only data are not a subset of the LSS data (see Section 4.1). Cosmological constraints from the BAO and LSS data are discussed in Sections 4 and 5.
| Label | Survey | zeff | Constraint | Reference |
|---|---|---|---|---|
| BAO-only | 6dFGS | 0.106 | rs/DV = 0.336 ± 0.015 | Beutler et al. (2011) |
| SDSS, DR7a | 0.35 | DA/rs = 6.875 ± 0.246 | Xu et al. (2013) | |
| 0.35 | Hrs = (12 895 ± 1070) km s−1 | |||
| WiggleZb | 0.44 | rs/DV = 0.0916 ± 0.0071 | Blake et al. (2011b) | |
| 0.60 | rs/DV = 0.0726 ± 0.0034 | |||
| 0.73 | rs/DV = 0.0592 ± 0.0032 | |||
| BOSS, DR9 CMASSc | 0.57 | |$D_{\rm A}(r_{\rm s}^{\rm fid}/r_{\rm s})=(1408\pm 45)$| Mpc | Anderson et al. (2013) | |
| 0.57 | |$H(r_{\rm s}/r_{\rm s}^{\rm fid})=(92.9\pm 7.8)$| km s−1 Mpc−1 | |||
| BOSS, Lyα forestd | 2.4 | αr; see text | Slosar et al. (2013) | |
| LSS | 6dFGS | 0.106 | rs/DV = 0.336 ± 0.015 | Beutler et al. (2011) |
| SDSS, DR7a | 0.35 | DA/rs = 6.875 ± 0.246 | Xu et al. (2013) | |
| 0.35 | Hrs = (12 895 ± 1070) km s−1 | |||
| WiggleZb | 0.44 | As = 0.474 ± 0.034 | Blake et al. (2012) | |
| 0.60 | As = 0.442 ± 0.020 | |||
| 0.73 | As = 0.424 ± 0.021 | |||
| 0.44 | F = 0.482 ± 0.049 | |||
| 0.60 | F = 0.650 ± 0.053 | |||
| 0.73 | F = 0.865 ± 0.073 | |||
| 0.44 | fσ8 = 0.413 ± 0.080 | |||
| 0.60 | fσ8 = 0.390 ± 0.063 | |||
| 0.73 | fσ8 = 0.437 ± 0.072 | |||
| BOSS, DR9 CMASSe | 0.57 | H = (87.6 ± 7.2) km s−1 Mpc−1 | Chuang et al. (2013) | |
| 0.57 | DA = (1396 ± 74) Mpc | |||
| 0.57 | Ωmh2 = 0.126 ± 0.019 | |||
| 0.57 | fσ8 = 0.428 ± 0.069 | |||
| BOSS, Lyα forestd | 2.4 | αr; see text | Slosar et al. (2013) |
| Label | Survey | zeff | Constraint | Reference |
|---|---|---|---|---|
| BAO-only | 6dFGS | 0.106 | rs/DV = 0.336 ± 0.015 | Beutler et al. (2011) |
| SDSS, DR7a | 0.35 | DA/rs = 6.875 ± 0.246 | Xu et al. (2013) | |
| 0.35 | Hrs = (12 895 ± 1070) km s−1 | |||
| WiggleZb | 0.44 | rs/DV = 0.0916 ± 0.0071 | Blake et al. (2011b) | |
| 0.60 | rs/DV = 0.0726 ± 0.0034 | |||
| 0.73 | rs/DV = 0.0592 ± 0.0032 | |||
| BOSS, DR9 CMASSc | 0.57 | |$D_{\rm A}(r_{\rm s}^{\rm fid}/r_{\rm s})=(1408\pm 45)$| Mpc | Anderson et al. (2013) | |
| 0.57 | |$H(r_{\rm s}/r_{\rm s}^{\rm fid})=(92.9\pm 7.8)$| km s−1 Mpc−1 | |||
| BOSS, Lyα forestd | 2.4 | αr; see text | Slosar et al. (2013) | |
| LSS | 6dFGS | 0.106 | rs/DV = 0.336 ± 0.015 | Beutler et al. (2011) |
| SDSS, DR7a | 0.35 | DA/rs = 6.875 ± 0.246 | Xu et al. (2013) | |
| 0.35 | Hrs = (12 895 ± 1070) km s−1 | |||
| WiggleZb | 0.44 | As = 0.474 ± 0.034 | Blake et al. (2012) | |
| 0.60 | As = 0.442 ± 0.020 | |||
| 0.73 | As = 0.424 ± 0.021 | |||
| 0.44 | F = 0.482 ± 0.049 | |||
| 0.60 | F = 0.650 ± 0.053 | |||
| 0.73 | F = 0.865 ± 0.073 | |||
| 0.44 | fσ8 = 0.413 ± 0.080 | |||
| 0.60 | fσ8 = 0.390 ± 0.063 | |||
| 0.73 | fσ8 = 0.437 ± 0.072 | |||
| BOSS, DR9 CMASSe | 0.57 | H = (87.6 ± 7.2) km s−1 Mpc−1 | Chuang et al. (2013) | |
| 0.57 | DA = (1396 ± 74) Mpc | |||
| 0.57 | Ωmh2 = 0.126 ± 0.019 | |||
| 0.57 | fσ8 = 0.428 ± 0.069 | |||
| BOSS, Lyα forestd | 2.4 | αr; see text | Slosar et al. (2013) |
aThe SDSS DR7 post-reconstruction measurements of DA/rs and Hrs are correlated with correlation coefficient 0.57.
bThe covariance matrix for the WiggleZ measurements is given in equation (4) of Hinshaw et al. (2012) for DV/rs and table 2 of Blake et al. (2012) for As, F and fσ8.
cThe BOSS DR9 CMASS sample post-reconstruction measurements of |$D_{\rm A}(r_{\rm s}/r_{\rm s}^{\rm fid})$| and |$H(r_{\rm s}/r_{\rm s}^{\rm fid})$| are correlated with correlation coefficient 0.55; the fiducial sound horizon, |$r_{\rm s}^{\rm fid}$|, adopted by Anderson et al. (2013) is |$r_{\rm s}^{\rm fid}=153.19$| Mpc.
dThe fiducial value of H rs (equation 3) adopted for the BOSS Lyα analysis is 3.62 × 10⁴ km s−1.
eThe covariance matrix between parameters in the full BOSS CMASS clustering analysis is given in equation (26) of Chuang et al. (2013).
The bottom part of Table 1 lists constraints used in our expanded analysis, including correlation function shape, AP and growth rate measurements, in addition to BAO feature position. It should be noted that the SDSS and BOSS CMASS samples have been re-analysed multiple times (e.g. Reid et al. 2010; Anderson et al. 2012; Padmanabhan et al. 2012; Samushia, Percival & Raccanelli 2012; Sánchez et al. 2013). Some choice of which constraints to adopt must therefore be made. Ideally, one would jointly fit to the ‘raw’ data – the correlation function or power spectrum measurements – from each sample, rather than to derived quantities such as DV/rs. The latter approach is, however, adequate for this work, since our conclusions are largely qualitative and relatively insensitive to the exact choice of constraint combination (although see comments on goodness-of-fit in Section 4.1).
Chuang et al. (2013) present a ‘single probe’ analysis of the BOSS CMASS data, jointly using BAO position, clustering shape and redshift-space distortion information to extract cosmological constraints, independent of DE evolution model, with broad priors on parameters not well constrained from their data. This work built upon earlier analysis using the SDSS sample at zeff = 0.35 (e.g. Chuang & Wang 2013). We opt not to include constraints from the earlier work in all our fits since they were found to be somewhat more sensitive to, for example, the range of separation scales used in correlation function fitting, although we consider the effect of their inclusion in the context of LSS constraints on H0 in Section 5.1.
The interdependence between BAO position and growth rate (Beutler et al. 2012) has not been quantified for the 6dFGS and so for the expanded LSS clustering analysis we choose to use only the BAO scale constraint, and similarly for the SDSS zeff = 0.35 sample. We do not include growth rate constraints from surveys outside those used for the BAO-only fit. This is a slightly arbitrary choice, however, the growth rate constraints from other surveys, including 2dFGRS (Hawkins et al. 2003), 2dF SDSS LRG and QSO Survey (2SLAQ; Ross et al. 2007), VIMOS VLT Deep Survey (VVDS; Guzzo et al. 2008) and VIMOS Public Extragalactic Redshift Survey (VIPERS; de la Torre et al. 2013), are statistically consistent with the constraints used here, and do not provide significant improvements for the models considered.
The WiggleZ and 6dFGS analyses fixed several parameters, including the baryon density and primordial power spectrum index, ns, based on Wilkinson Microwave Anisotropy Probe (WMAP) constraints (Komatsu et al. 2011). We do not view these assumptions as likely to lead to either bias in inferred BAO constraints, or significant interdependence between CMB and BAO or LSS constraints for the ΛCDM and wCDM models discussed in this work. The WiggleZ and 6dFGS data sets constrain DV/rs or As to around 5 per cent. The sound horizon varies very weakly with Ωb h2 for the cosmologies we consider (rs ∝ (Ωb h2)−0.13), and is, furthermore, constrained to better than 1.5 per cent by the CMB (Planck Collaboration XVI 2013). Eisenstein et al. (2005) found that the acoustic parameter, As, scales as |$n_{\rm s}^{-0.35}$| from fitting to SDSS data. Assuming this relation, shifting a WiggleZ As value by 0.5σ requires a 7σ shift in ns (as inferred from current CMB data for either ΛCDM or wCDM). The high precision of CMB constraints essentially means that uncertainty in these parameters is subdominant to sample variance for the WiggleZ and 6dFGS data. Far weaker CMB-based assumptions can be, and are, adopted for the more precise BAO and LSS measurements from SDSS and BOSS.
Blake et al. (2011c) used clustering information on scales down to k = 0.3 h Mpc−1 to extract the WiggleZ growth rate constraints. To check that uncertainties relating to non-linear effects on these scales are not significantly biasing our results, we repeated the BAO plus LSS fit with the WiggleZ constraints removed. While parameter constraints are degraded (by up to a factor of 2 in the case of σ8), the shifts in the peaks of the marginalized parameter posterior probability distributions are small – at most around 20 per cent of a statistical standard deviation – for all parameters.
Busca et al. (2013) present an analysis of largely the same Lyα sample used by Slosar et al. (2013), but with various differences in data cuts and methodology (see section 5.4 of Slosar et al. 2013). We discuss the effects of using the Busca et al. (2013) results rather than those of Slosar et al. (2013) in Section 5.1.
We explore parameter spaces using a Markov chain Monte Carlo (MCMC) method, specifically the affine-invariant ‘stretch step’ ensemble sampler proposed by Goodman & Weare (2010) and parallelized in the emcee2python module by Foreman-Mackey et al. (2013). For the relatively small number of parameters we consider here, a tuned Metropolis sampler (Metropolis, Rosenbluth & Rosenbluth 1953; Dunkley et al. 2005) would likely be more efficient, however, we expect that the flexibility and parallel nature of the stretch step approach (above references and Akeret et al. 2012) to prove useful as we include more data sets in future analysis.
4 RESULTS
In this section we discuss constraints from the BAO-only and LSS clustering fits and compare to the latest CMB results. Here and throughout, ‘CMB’ refers to a joint fit to the Planck 2013 temperature and lensing power spectra (Planck Collaboration XV 2013; Planck Collaboration XVII 2013), WMAP 9-year polarization data (Bennett et al. 2012) and small-scale temperature power spectra from the Atacama Cosmology Telescope (ACT; Das et al. 2013) and the South Pole Telescope (SPT; Reichardt et al. 2012). We show constraints from MCMC chains provided by the Planck collaboration.3 Comparisons with other data sets are made in Section 5.
4.1 |$\boldsymbol {\Lambda }$|CDM
For the ΛCDM fit to BAO position measurements alone we find Ωm = 0.304 ± 0.040 and H0 rs = (1.035 ± 0.024) × 104 km s−1. We report mean parameter values and the boundaries of the symmetric 68.3 per cent and, in some cases, 95.5 per cent confidence intervals. Constraints in the H0 rs–Ωm plane are shown in Fig. 1 for the combined BAO data as well as the z = 0.106 6dFGS, z = 0.57 BOSS CMASS and z = 2.4 BOSS Lyα constraints individually. We show CMB constraints for the ΛCDM model in the same plane.
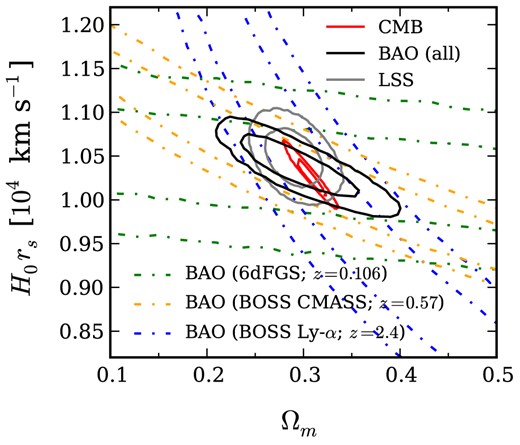
ΛCDM constraints from measurements of BAO position. We show 68.3 and 95.5 per cent confidence contours for the combined BAO data set (Table 1, top), and for the 6dFGS (Beutler et al. 2011), BOSS CMASS (Anderson et al. 2013) and BOSS Lyα (Slosar et al. 2013) data separately, to illustrate their complementarity. Constraints from our expanded analysis including other LSS clustering constraints (Table 1, bottom), and CMB constraints from combining Planck, WMAP, ACT and SPT data (Planck Collaboration XVI 2013) are also shown. The BAO, LSS and CMB constraints are in good agreement for the ΛCDM model.

Cosmological constraints from BAO position only (using constraints from top part of Table 1), BAO position plus a baryon density prior from estimation of the primordial deuterium abundance (Section 5.1), LSS clustering (bottom part of Table 1) and the latest CMB measurements (Planck temperature and lensing power spectra plus WMAP polarization and ACT and SPT small-scale temperature power spectra; Planck Collaboration XVI 2013). We show 68.3 per cent confidence intervals for all parameters and additionally show 95.5 per cent confidence intervals for w.
| Model | Parameter | BAO-only | BAO+Ωb h2 | LSS | CMB-only |
|---|---|---|---|---|---|
| ΛCDM | Ωm | 0.304 ± 0.040 | |$0.308^{+0.040}_{-0.041}$| | 0.290 ± 0.019 | 0.307 ± 0.013 |
| H0 rs/104 km s−1 | 1.035 ± 0.024 | 1.033 ± 0.024 | 1.048 ± 0.022 | |$1.027^{+0.018}_{-0.017}$| | |
| H0/km s−1 Mpc−1 | – | 68.9 ± 3.0 | 67.5 ± 2.8 | 67.9 ± 1.0 | |
| σ8 | – | – | 0.802 ± 0.047 | 0.8233 ± 0.0097 | |
| wCDM | w | |$-1.06^{+0.33\,+0.63}_{-0.32\,-0.72}$| | |$-1.11^{+0.32\,+0.61}_{-0.32\,-0.71}$| | |$-1.14^{+0.19\,+0.36}_{-0.19\,-0.42}$| | |$-1.49^{+0.30\,+0.62}_{-0.29\,-0.42}$| |
| Ωm | |$0.292^{+0.045}_{-0.040}$| | |$0.299^{+0.042}_{-0.040}$| | |$0.275^{+0.030}_{-0.029}$| | |$0.204^{+0.052}_{-0.051}$| | |
| H0 rs/104 km s−1 | 1.045 ± 0.058 | 1.050 ± 0.057 | 1.076 ± 0.045 | |$1.287^{+0.219}_{-0.166}$| | |
| H0/km s−1 Mpc−1 | – | 70.7 ± 7.7 | 70.1 ± 4.8 | 85.0 ± 10.9 | |
| σ8 | – | – | 0.77 ± 0.07 | 0.96 ± 0.08 |
| Model | Parameter | BAO-only | BAO+Ωb h2 | LSS | CMB-only |
|---|---|---|---|---|---|
| ΛCDM | Ωm | 0.304 ± 0.040 | |$0.308^{+0.040}_{-0.041}$| | 0.290 ± 0.019 | 0.307 ± 0.013 |
| H0 rs/104 km s−1 | 1.035 ± 0.024 | 1.033 ± 0.024 | 1.048 ± 0.022 | |$1.027^{+0.018}_{-0.017}$| | |
| H0/km s−1 Mpc−1 | – | 68.9 ± 3.0 | 67.5 ± 2.8 | 67.9 ± 1.0 | |
| σ8 | – | – | 0.802 ± 0.047 | 0.8233 ± 0.0097 | |
| wCDM | w | |$-1.06^{+0.33\,+0.63}_{-0.32\,-0.72}$| | |$-1.11^{+0.32\,+0.61}_{-0.32\,-0.71}$| | |$-1.14^{+0.19\,+0.36}_{-0.19\,-0.42}$| | |$-1.49^{+0.30\,+0.62}_{-0.29\,-0.42}$| |
| Ωm | |$0.292^{+0.045}_{-0.040}$| | |$0.299^{+0.042}_{-0.040}$| | |$0.275^{+0.030}_{-0.029}$| | |$0.204^{+0.052}_{-0.051}$| | |
| H0 rs/104 km s−1 | 1.045 ± 0.058 | 1.050 ± 0.057 | 1.076 ± 0.045 | |$1.287^{+0.219}_{-0.166}$| | |
| H0/km s−1 Mpc−1 | – | 70.7 ± 7.7 | 70.1 ± 4.8 | 85.0 ± 10.9 | |
| σ8 | – | – | 0.77 ± 0.07 | 0.96 ± 0.08 |
Cosmological constraints from BAO position only (using constraints from top part of Table 1), BAO position plus a baryon density prior from estimation of the primordial deuterium abundance (Section 5.1), LSS clustering (bottom part of Table 1) and the latest CMB measurements (Planck temperature and lensing power spectra plus WMAP polarization and ACT and SPT small-scale temperature power spectra; Planck Collaboration XVI 2013). We show 68.3 per cent confidence intervals for all parameters and additionally show 95.5 per cent confidence intervals for w.
| Model | Parameter | BAO-only | BAO+Ωb h2 | LSS | CMB-only |
|---|---|---|---|---|---|
| ΛCDM | Ωm | 0.304 ± 0.040 | |$0.308^{+0.040}_{-0.041}$| | 0.290 ± 0.019 | 0.307 ± 0.013 |
| H0 rs/104 km s−1 | 1.035 ± 0.024 | 1.033 ± 0.024 | 1.048 ± 0.022 | |$1.027^{+0.018}_{-0.017}$| | |
| H0/km s−1 Mpc−1 | – | 68.9 ± 3.0 | 67.5 ± 2.8 | 67.9 ± 1.0 | |
| σ8 | – | – | 0.802 ± 0.047 | 0.8233 ± 0.0097 | |
| wCDM | w | |$-1.06^{+0.33\,+0.63}_{-0.32\,-0.72}$| | |$-1.11^{+0.32\,+0.61}_{-0.32\,-0.71}$| | |$-1.14^{+0.19\,+0.36}_{-0.19\,-0.42}$| | |$-1.49^{+0.30\,+0.62}_{-0.29\,-0.42}$| |
| Ωm | |$0.292^{+0.045}_{-0.040}$| | |$0.299^{+0.042}_{-0.040}$| | |$0.275^{+0.030}_{-0.029}$| | |$0.204^{+0.052}_{-0.051}$| | |
| H0 rs/104 km s−1 | 1.045 ± 0.058 | 1.050 ± 0.057 | 1.076 ± 0.045 | |$1.287^{+0.219}_{-0.166}$| | |
| H0/km s−1 Mpc−1 | – | 70.7 ± 7.7 | 70.1 ± 4.8 | 85.0 ± 10.9 | |
| σ8 | – | – | 0.77 ± 0.07 | 0.96 ± 0.08 |
| Model | Parameter | BAO-only | BAO+Ωb h2 | LSS | CMB-only |
|---|---|---|---|---|---|
| ΛCDM | Ωm | 0.304 ± 0.040 | |$0.308^{+0.040}_{-0.041}$| | 0.290 ± 0.019 | 0.307 ± 0.013 |
| H0 rs/104 km s−1 | 1.035 ± 0.024 | 1.033 ± 0.024 | 1.048 ± 0.022 | |$1.027^{+0.018}_{-0.017}$| | |
| H0/km s−1 Mpc−1 | – | 68.9 ± 3.0 | 67.5 ± 2.8 | 67.9 ± 1.0 | |
| σ8 | – | – | 0.802 ± 0.047 | 0.8233 ± 0.0097 | |
| wCDM | w | |$-1.06^{+0.33\,+0.63}_{-0.32\,-0.72}$| | |$-1.11^{+0.32\,+0.61}_{-0.32\,-0.71}$| | |$-1.14^{+0.19\,+0.36}_{-0.19\,-0.42}$| | |$-1.49^{+0.30\,+0.62}_{-0.29\,-0.42}$| |
| Ωm | |$0.292^{+0.045}_{-0.040}$| | |$0.299^{+0.042}_{-0.040}$| | |$0.275^{+0.030}_{-0.029}$| | |$0.204^{+0.052}_{-0.051}$| | |
| H0 rs/104 km s−1 | 1.045 ± 0.058 | 1.050 ± 0.057 | 1.076 ± 0.045 | |$1.287^{+0.219}_{-0.166}$| | |
| H0/km s−1 Mpc−1 | – | 70.7 ± 7.7 | 70.1 ± 4.8 | 85.0 ± 10.9 | |
| σ8 | – | – | 0.77 ± 0.07 | 0.96 ± 0.08 |
Notice that the LSS data contour in Fig. 1 contain regions disfavoured in the BAO-only fit. This is because the strongest LSS constraints do not depend explicitly on the sound horizon, rs. The BOSS CMASS and WiggleZ analyses used in the LSS fit (Blake et al. 2012; Chuang et al. 2013) focus on the shape of the galaxy correlation function – the dependence on rs is effectively marginalized over in the case of Chuang et al. (2013), and negligible in the case of Blake et al. (2012), because the BAO feature is not significantly detected in the two-dimensional WiggleZ power spectrum. In the joint fit with the other galaxy survey constraints, the reduction in information about rs compared to the BAO-only BOSS and WiggleZ analyses leads to a broadening of constraints in the direction roughly perpendicular to the BAO-only BOSS contours (Fig. 1). Using the Blake et al. (2012) and Chuang et al. (2013) results does, however, lead to tighter constraints on the parameters of most interest in this analysis – Ωm and w, when it is free – partially breaking the degeneracy apparent in the BAO-only contours.
The LSS ΛCDM constraint of Ωm = 0.290 ± 0.019 is around 50 per cent weaker than that from current CMB data; it is worth pointing out, though, that it is comparable or stronger than any pre-Planck CMB measurement – the WMAP-9 68 per cent uncertainty on Ωm is 0.025, while that from combining WMAP-9 with SPT data is 0.019 (Calabrese et al. 2013), for example. It is realistic to expect LSS to constrain Ωm with comparable precision to Planck in the fairly near future.
The χ2 value corresponding to the maximum likelihood from the BAO-only ΛCDM chain is 1.73. We are fitting to a total of nine data points with two parameters (Ωm and H0 rs); the probability for χ2 per degree of freedom (dof) to exceed the measured value (PTE) is very high – 0.97. This issue is exacerbated in the fit including the additional LSS data: we find χ2/dof = 3.5/(17 − 4) (PTE of 0.995). The high PTE values remain if we remove the Lyα constraint and our associated non-Gaussian likelihood. Our analysis neglects interdependence between constraints from different surveys. There is partial overlap in both redshift and sky coverage for WiggleZ and BOSS (see fig. 1 of Drinkwater et al. 2010 and fig. 1 of Ahn et al. 2012), however, 70 per cent of the BOSS sky coverage lies outside the WiggleZ regions, and these surveys use somewhat different galaxy selection criteria. We have confirmed that the high PTE remains even if we repeat our fits omitting the constraints from one of these two surveys.
It seems plausible that uncertainties on derived quantities used in this work, such as DV/rs and fσ8, may be overestimated as a result of individual analyses conservatively choosing methodology approaches that lead to the broadest constraints. Chuang, Wang & Hemantha (2012) found that estimating LSS clustering bandpower covariance using lognormal realizations to approximate non-linearities in the density field (Coles & Jones 1991; Percival et al. 2004), rather than N-body simulations, leads to systematically larger uncertainties. This could contribute to the high PTE in the case of the WiggleZ and 6dFGS data, where the lognormal method was used (Beutler et al. 2011; Blake et al. 2011a). We therefore expect the issue of high PTE to be largely resolved through a combination of fitting directly to correlation function or power spectrum measurements, and future improvements in LSS analysis methodology.
4.2 |$\boldsymbol {w}$|CDM
For wCDM, the BAO position measurements alone constrain |$w=-1.06^{+0.33}_{-0.32}$|, |$\Omega _{\rm m}=0.292^{+0.045}_{-0.040}$| and H0 rs = (1.045 ± 0.058) × 104 km s−1. Addition of the clustering shape, AP and growth rate constraints tighten wCDM constraints, although not to the extent that they did for ΛCDM, with the w constraint improving to −1.14 ± 0.19. The χ2 for the LSS wCDM fit is improved by 0.3 compared to ΛCDM; currently, there is no significant evidence for departures from Λ-acceleration from LSS data. The BAO and LSS data constraints on other parameters are fairly robust to allowing freedom in w, while the CMB constraints are significantly broadened. The CMB data exhibit a mild (∼1.5σ) preference for w < −1, which leads to shifts in the other parameters shown in Table 2, since these parameters are highly correlated with w when constrained with the CMB alone (see fig. 21 of Planck Collaboration XVI 2013).
Chuang et al. (2013) found that including growth rate measurements improved constraints on w in a joint fit using the BOSS CMASS sample and CMB data. It is worth noting here that, in our fit to the LSS clustering data only, the growth rate measurements effectively only constrain σ8, and contribute minimally to constraints on Ωm or w. This is because fσ8 depends weakly on redshift for z < 1 and so there is little leverage for current growth rate measurements to improve expansion history constraints in the absence of an external constraint on σ8. In Section 5.2, we show that the growth rate σ8 constraint does, however, play an important role when assessing the extent to which allowing w ≠ −1 can relieve tension between the CMB and low-redshift data sets.
5 DISCUSSION
5.1 Comparison with distance ladder |$\boldsymbol {H_0}$| measurements
Fig. 2 compares marginalized constraints on H0. We show the local distance ladder measurements of H0 = (73.8 ± 2.4) km s−1 Mpc−1 measured using Cepheid variable stars and low-redshift Type IA SNe observed with the Hubble Space Telescope (HST) by Riess et al. (2011). Similar results were obtained from a more recent re-analysis of HST Cepheid and SNe data using a new estimate of the distance to the Large Magellanic Cloud calibrated using 3.6 μm observations (Freedman et al. 2012).
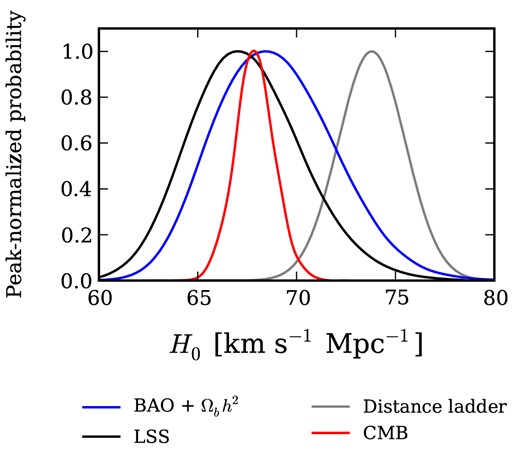
Marginalized H0 constraints for the ΛCDM model. While BAO position measurements alone do not constraint H0, a constraint may be obtained by either adding information from the shape of the LSS correlation function, or adding a prior on the baryon density (here we use the CMB-independent constraint from primordial deuterium abundance estimated by Pettini & Cooke 2012). In either case, there is a mild preference for a lower H0 value than the distance ladder measurements, consistent with recent Planck results. Note that the choice of LSS constraints moderately affects this comparison (see text).

The BAO position measurements alone do not provide any H0 constraint, being sensitive only to the combination H0 rs. In addition to H0 and Ωm, the sound horizon depends on the physical baryon density, Ωb h2, though only weakly – rs ∝ (Ωb h2)−0.13 for the cosmological models considered here. We are therefore able to obtain constraints on H0 from the BAO position measurements with the addition of a prior on the baryon density (and the CMB mean temperature, which determines the energy density in radiation, and which we hold fixed to 2.72548 K; Fixsen 2009). The most precise constraints on the baryon density outside the CMB come from estimates of the primordial deuterium abundance from metal-poor damped Lyα systems. Recently, Pettini & Cooke (2012) found Ωb h2 = 0.0223 ± 0.0009 (assuming no non-standard relativistic species) for a system particularly well suited to this measurement at z ∼ 3. Adopting this constraint as a Gaussian prior and repeating the fit to the BAO data in the top part of Table 1 using the parameter set {Ωm, Ωb h2, H0}, yields H0 = 68.9 ± 3.0 km s−1 Mpc−1. Alternatively, using a weak CMB-based prior of Ωb h2 = 0.02218 ± 0.00130, five times wider than the CMB-only 68 per cent confidence constraint from Planck Collaboration XVI (2013), gives H0 = 68.8 ± 3.1 km s−1 Mpc−1. These values are in good agreement with the LSS clustering constraint and lower by around 1.3σ than the Riess et al. (2011) value. Note that the baryon density is determined from the CMB power spectrum largely through the relative heights of acoustic peaks, rather than their spacing – this weak CMB-based baryon density prior is highly robust to modifications that could alter the acoustic scale, such as extra relativistic species.
It should be noted that the Lyα data dominate the H0 constraint in the BAO position plus baryon density fit; removing this data point, we find H0 = 70.1 ± 7.1 km s−1 Mpc−1 for the deuterium abundance Ωb h2 prior. The high-redshift information partially breaks degeneracies present in the low-redshift constraints (Fig. 1). Using the Busca et al. (2013) Lyα constraint of |$\alpha _{\rm r}^{-1}=0.954\pm 0.077$| (for their method 2 and broad-band parametrization of their equation 24), rather than that of Slosar et al. (2013), gives H0 = 66.8 ± 3.7 km s−1 Mpc−1. On the other hand, using the isotropic Lyα constraint from Slosar et al. (2013), rather than simply the measurement in the radial direction, and assuming the isotropic distortion parameter |$\alpha _{\rm iso}\propto D_{\rm A}^{0.2}H^{-0.8}$| (Busca et al. 2013), we find H0 = 69.2 ± 2.3 km s−1 Mpc−1.
In the expanded LSS clustering analysis, H0 is constrained from the shape of the galaxy correlation function, which is sensitive to Ωm h2. The resulting ΛCDM constraint of 67.5 ± 2.8 km s−1 Mpc−1 is in mild (1.7σ) tension with the direct H0 measurement. The choice of which galaxy clustering constraints to rely on has some effect here; adding the constraint on Ωm h2 from the zeff = 0.35 SDSS sample from Chuang & Wang (2013), which was not included in our base LSS fit (Section 3), shifts the H0 constraint to 66.5 ± 2.1 km s−1 Mpc−1, which is in tension with the Riess et al. (2011) measurement at around the 2.2σ level, while remaining in good agreement with the CMB value.
Overall, then, we find that the LSS clustering data exhibit qualitatively the same tension with the distance ladder H0 measurements, assuming a ΛCDM model, as the Planck data, preferring a lower H0 value, although only at fairly weak statistical significance. Clearly, this difference could be largely, or solely, the result of statistical fluctuation. We also discuss the extent to which allowing w ≠ −1 relieves this, and other, ΛCDM tensions in Section 5.2, below. Discussion of other extensions, such as increasing the number of effective neutrino species, is deferred to future work.
Because of the weak dependence of the sound horizon on the baryon density, the uncertainties given in this section are largely limited by statistical uncertainties in the BAO and LSS clustering data. There is therefore scope for considerable improvement in (model-dependent) H0 constraints with future LSS clustering data, particularly at high redshift, with minimal dependence on the CMB measurement of the acoustic scale.
5.2 Comparison with Type IA supernovae measurements and allowing |$\boldsymbol {w\ne -1}$|
Measurements of Type IA SNe brightness as a function of redshift constrain the expansion history, and thus Ωm and w, if an empirical correlation between luminosity and light-curve shape is assumed (for discussion of the role of SNe as DE probes; see Weinberg et al. 2012, and references therein). These constraints can be directly compared to those from the BAO position and LSS clustering data. In this work, we compare to the Supernova Legacy Survey (SNLS) compilation, consisting of 472 SNe from various surveys, and analysed by Conley et al. (2011), with marginalization over nuisance parameters relating to known SNe systematic uncertainties.
For the ΛCDM model, the SNLS compilation gives Ωm = 0.232 ± 0.039 (68 per cent confidence). This is in agreement with, though around 1.3σ lower than, the BAO or LSS constraints of 0.304 ± 0.040 and 0.290 ± 0.019, respectively. As with H0, BAO and LSS constraints on Ωm are expected to improve significantly in the relatively near future (Section 5.4).
It is interesting to consider the combined LSS, SNe, distance ladder and CMB data in the context of the wCDM model. Taking all quoted uncertainties at face value, combining either the SNLS SNe or distance ladder measurements with CMB data leads to a preference for w < −1 at 2σ (95 per cent confidence limits of |$w=-1.13^{+0.13}_{-0.14}$| and |${-}1.24^{+0.18}_{-0.19}$|, respectively; Planck Collaboration XVI 2013). If we consider two-dimensional contour plots from the triplet of parameters {w, Ωm, H0}, a value of w ≃ −1.2, with Ωm ≃ 0.26 and H0 ≃ 73 km s−1 Mpc−1, appears to effectively relieve the tension in the combined data set (Fig. 3). For both the CMB and LSS, w and Ωm are positively correlated, and w and H0 are anticorrelated. Thus, allowing w < −1 both increases H0, improving agreement with the distance ladder measurements, and decreases Ωm, improving agreement with the SNe.
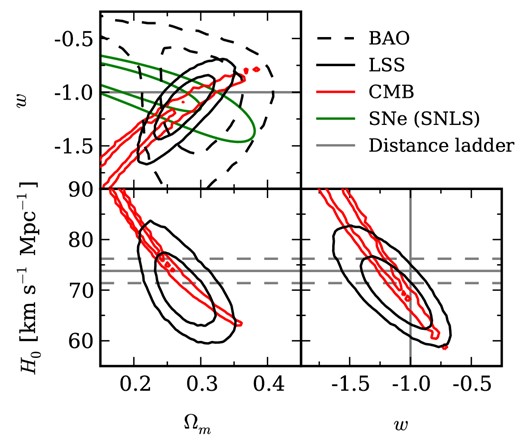
Marginalized two-dimensional constraints from the triplet of parameters {w, Ωm, H0} for the wCDM model. We compare results from the BAO and LSS clustering analyses in this work with the latest CMB constraints (Planck Collaboration XVI 2013), the SNLS SNe compilation (Conley et al. 2011) and local distance ladder H0 measurements (Riess et al. 2011). Decreasing w below −1 appears to relieve the ΛCDM tension between these data sets when these three parameters are considered – but see Fig. 4.

The situation changes somewhat when we consider LSS growth rate constraints on σ8 with w free. In Fig. 4, we show constraints in the w–σ8 plane. In order to include distance ladder and SNe constraints in this comparison, we used the publicly available Planck CMB plus SNLS MCMC chain that was importance sampled with the Riess et al. (2011) H0 prior, having established that there is statistical agreement between the CMB, SNe and distance ladder data in the wCDM model (Fig. 3).
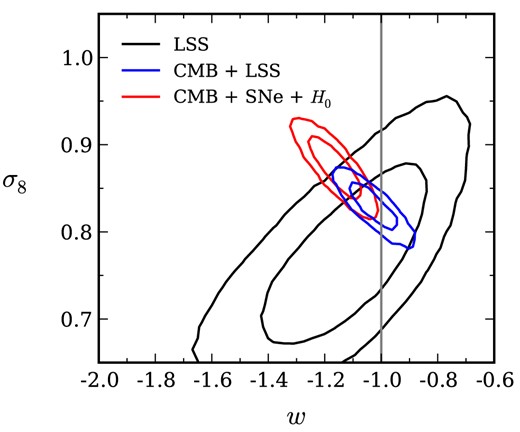
Marginalized σ8 and w constraints (68.3 and 95.5 per cent confidence) in the wCDM model. While tension in the combined CMB, SNe and distance ladder data set is effectively relieved by allowing w < −1 (Fig. 3), the resulting σ8 constraint is in moderate tension with the LSS growth rate constraints from redshift-space distortion measurements. Note that the CMB and LSS constraints on σ8 are in good agreement for the ΛCDM model (Table 2); the combined CMB and LSS constraint is w = −1.03 ± 0.06.

Decreasing w below −1 quickly leads to tension between the LSS and CMB determinations of σ8, which are in good agreement for ΛCDM – see Table 2. Consequently, when the constraints on σ8 from the growth rate measurements are considered, allowing w < −1 appears less effective at relieving tension in the combined CMB, LSS, distance ladder and SNe data set.
It is worth examining why the CMB and LSS contours in Fig. 4 are roughly orthogonal. For the flat wCDM model, the constraints on w, Ωm and H0 from the CMB are driven by the requirements that the angular diameter distance to last scattering, and the physical matter density, Ωm h2, remain roughly fixed. This is achieved via the contours shown in Fig. 3, and for w < −1 leads to a universe with a lower fractional matter density at the present time than inferred for w = −1. The dominant effect for σ8 is an increase in H0, which means σ8 corresponds to rms mass fluctuations in smaller spheres (by definition, σ8 is the rms fluctuation in spheres of radius 8 h−1 Mpc). The CMB prediction for σ8 is therefore higher for w < −1 than for ΛCDM.
5.3 Comparison with cluster counts and weak lensing shear correlation measurements
Incorporating growth rate constraints from redshift-space distortions also allows us to compare the LSS constraints in the σ8–Ωm plane to other low-redshift probes of the amplitude of matter fluctuations, including counts of galaxy clusters and galaxy weak gravitational lensing measurements. This comparison is made in Fig. 5 assuming a ΛCDM model, using a pair of recent constraints. We have plotted contours corresponding to σ8(Ωm/0.27)0.6 = 0.79 ± 0.03 from the weak lensing shear correlation function analysis of data from the Canada–France–Hawaii Telescope Lensing Survey (CFHTLens; Kilbinger et al. 2013), and σ8(Ωm/0.29)0.322 = 0.775 ± 0.010 from a cosmological analysis of clusters selected by the thermal Sunyaev–Zel'dovich (SZ) effect using Planck (Planck Collaboration XX 2013). We do not see any degree of tension between the LSS clustering and other data sets here, although there is clearly some tension between the CMB power spectrum data and the weak lensing and cluster count constraints (see also sections 5.5.2 and 5.5.3 of Planck Collaboration XVI 2013).
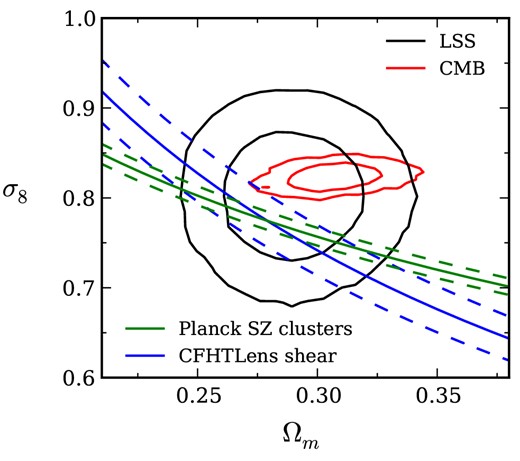
Comparison of ΛCDM constraints (68.3 and 95.5 per cent confidence) in the σ8–Ωm plane for CMB and several low-redshift data sets. While growth rate information from redshift-space distortions allows LSS clustering measurements to constrain σ8, current precision is too low to meaningfully inform the comparison of CMB constraints with those from (for instance) cluster abundance (Planck Collaboration XX 2013) or weak lensing shear correlations (Kilbinger et al. 2013).

There is minimal correlation between σ8 and Ωm from current LSS data; making a more meaningful comparison using LSS clustering essentially requires tighter constraints on the growth rate to better measure σ8.
5.4 Future data
The Lyα data are a powerful complement to the galaxy clustering measurements at lower redshift. Without the BOSS Lyα point, errors on Ωm are more than doubled for the BAO-only ΛCDM model, and tripled for wCDM. Constraints on w itself are also greatly degraded, such that w is almost unconstrained from below. When additional LSS constraints are included, the relative importance of the Lyα constraint is diminished; removing the Lyα constrain degrades the LSS w constraint by around 15 per cent, from −1.14 ± 0.19 to −1.18 ± 0.22. Given that the Lyα BAO constraints rely on analysis methodology less mature than used for the galaxy clustering measurements, it is encouraging that the shift in mean w value from removing the Lyα constraint is small compared to uncertainties.
As mentioned in Section 1, the quality and quantity of BAO position and LSS clustering data will improve considerably in coming months and years. The BOSS survey is expected to provide spectroscopic detections of roughly three times more galaxies than in the DR9 release, and around 50 per cent more quasars, leading to significant improvements over the constraints used in our analysis, particularly for the Lyα BAO measurements (Schlegel, White & Eisenstein 2009). Various upcoming surveys are targeting BAO in the z > 1 universe, including the Dark Energy Survey4 (The Dark Energy Survey Collaboration 2005), Mid-Scale Dark Energy Spectroscopic Instrument (MS-DESI), Hobby–Eberly Telescope Dark Energy Experiment (HETDEX)5 (Hill et al. 2009) and, looking further ahead, Wide-Field Infrared Survey Telescope (WFIRST)6 and Euclid7 (Amendola et al. 2013). Many of these experiments will also attempt to constrain DE in other ways, using Type IA SNe, galaxy weak lensing and cluster abundance, for example.
Telescopes including the Canadian H i Intensity Mapping Experiment8 (CHIME), currently under construction in western Canada, plan to measure high-redshift BAO using H i intensity fluctuations. If the Galactic synchrotron foreground can be removed, CHIME has the potential to cheaply and quickly yield very competitive DE constraints from a diffuse tracer of LSS.
We also note that BAO constraints at low redshift (z ≲ 0.2), from surveys such as Widefield ASKAP L-Band Legacy All-Sky Blind Survey (WALLABY)9 and Transforming Astronomical Imaging surveys through Polychromatic Analysis of Nebulae (TAIPAN), would significantly improve on constraints from the 6dFGS (Beutler et al. 2011). Amongst other things, these data would yield strong constraints on H0 through an approach like that discussed in Section 5.1, when combined with high-redshift information.
We have highlighted the usefulness of growth rate constraints in both improving DE constraints and assessing consistency between data sets (Sections 5.2 and 5.3). There are also good prospects for future improvement in these measurements (e.g. Weinberg et al. 2012).
Our analysis of current LSS constraints demonstrates that we are already able to make meaningful comparisons between low-redshift data even without strong priors from the high-redshift universe probed by the CMB. It seems likely, if not inevitable, that future ΛCDM tensions between different cosmological probes will continue to arise as new data become available and constraints become more precise. Even if such tensions do not end up being ascribed to new physics, we must put ourselves in a position to make that assessment as robustly as possible. Examining different combinations of low-redshift data with and without CMB constraints should be a useful part of this process.
6 CONCLUSIONS
We have performed joint fits of cosmological parameters to current BAO position and LSS clustering measurements. We have shown that the BAO and LSS data are now of sufficiently high precision to make useful comparisons with other low-redshift cosmological probes in the virtual absence of CMB anisotropy constraints. We find that the BAO and LSS constraints are in good agreement with the latest CMB results from Planck for the ΛCDM model, and mildly prefer a lower value of H0, and higher value of Ωm, than some recent local distance ladder and Type IA SNe measurements (Sections 5.1 and 5.2).
We note that the ΛCDM tension between Planck, distance ladder and SNe data reported by Planck Collaboration XVI (2013) appears to be effectively relieved by allowing w < −1, and that the CMB and LSS clustering data separately tolerate such behaviour. We show that the growth rate constraint on σ8 from redshift-space distortions is, however, in some tension with the combined CMB, distance ladder and SNe constraint in the wCDM model. Combining CMB, BAO and LSS data, including the growth rate information, we find w = −1.03 ± 0.06; this constraint is around 30 per cent tighter than for CMB plus BAO position only, and completely consistent with ΛCDM.
GEA acknowledges support from a Canadian Institute for Theoretical Astrophysics (CITA) National Fellowship. This work was also supported by the Natural Sciences and Engineering Research Council of Canada (NSERC) and the Canadian Institute for Advanced Research (CIFAR). The authors would like to thank Chris Blake, Nicolás Busca, Chia-Hsun Chuang and Will Percival for clarification regarding the BAO and LSS measurements, Wendy Freedman for information relating to the distance ladder H0 measurements and Alex Conley for providing likelihood contours from the Conley et al. (2011) SNLS analysis. We also thank the referee for useful comments and suggestions.
Komatsu (private communication).