This study reports the relationship between the diversity and functioning of fungal and bacterial soil communities with vegetation in Mediterranean woodland that experienced severe die-off after a drought episode. Terminal restriction fragment length polymorfism (TRFLP) was used to describe microbial community structure and diversity five years after the episode in different habitats (Juniperus woodland, shrubland, grassland), when the vegetation had not yet recovered. Vegetation diversity was positively related to TRF bacterial richness under unaffected canopies and was higher in diverse grassland. Fungal TRF richness correlated with vegetation type, being greater in Juniperus woodland. Microbial respiration increased in grassland, whereas microbial biomass, estimated from soil substrate-induced respiration (SIR), decreased with bacterial diversity. Die-off increased bacterial richness and changed bacterial composition, particularly in Juniperus woodland, where herbaceous species increased, while fungal diversity was reduced in Juniperus woodland. Die-off increased microbial respiration rates. The impact on vegetation from extreme weather episodes spread to microbial communities by modifying vegetation composition and litter quantity and quality, particularly as a result of the increase in herbaceous species. Our results suggest that climate-induced die-off triggers significant cascade effects on soil microbial communities, which may in turn further influence ecosystem C dynamics.
INTRODUCTION
The structure and functioning of soil microbial communities are sensitive to climate change (e.g. Waldrop and Firestone 2006; Sheik et al., 2011; Deslippe et al., 2012). However, the response of these communities to extreme climate episodes remains largely unknown (Berard et al., 2011; Meisner et al., 2013). In addition to the observed rise in earth temperature, episodes of climatic anomaly, such as intense drought events, are expected to become more frequent and intense in the coming decades in many regions (IPCC 2013). These extreme drought events may produce generalized vegetation die-off and mortality (van Mantgem et al., 2009; Allen et al., 2010), particularly in the Mediterranean Basin region (Lloret, Siscart and Dalmases 2004). The response of soil microbial communities to extreme climatic events is to some extent determined by the impact on standing vegetation, because vegetation alteration produces changes in soil microclimate, soil organic matter (SOM) and rhizosphere (Bardgett, Freeman and Ostle 2008; Sagova-Mareckova et al., 2011). Therefore, understanding the impact of extreme weather events implies prior knowledge of the relationship between soil microbial communities and standing vegetation, followed by an appraisal of how this relationship is modified when a die-off occurs.
Apart from soil chemistry, vegetation controls key processes that influence soil microbial communities (Zak et al., 2003; Waldrop et al., 2006; Ushio et al., 2008; Mitchell et al., 2012), particularly those determining litter quantity and quality (Bais et al., 2006). Nevertheless, the relationship between the diversity of above-ground vegetation and soil microbial communities has not been analyzed in many ecological contexts. Previous studies have often merely described broad patterns at a regional scale or compared contrasting habitats (but see Eskelinen, Stark and Mannisto 2009; Cregger et al., 2012). This relationship may be altered under strong abiotic stress, thereby causing significant damage to vegetation. The resulting outcomes, however, are uncertain: soil microbial diversity can be diminished because losses in vegetation diversity would reduce the chemical diversity of the substrate; alternatively, vegetation die-off can increase the amount of dead organic matter for microbial consumption, thus favoring microhabitat heterogeneity.
This study described the diversity, structure and functioning of soil microbial communities in three types of vegetation (grassland, shrubland and Juniperus woodland) of Mediterranean coastal South Spain that experienced a severe episode of drought and cold temperature. This episode resulted in an extensive die-off of the woody vegetation (shrubland and Juniperus woodland) (del Cacho and Lloret 2012). One characteristic of this study system was the homogeneity of the soil substrate, which consists of recent sandy deposits. This homogeneity minimized chemical and structural variability at the micro-scale level. We used vegetation surveys to estimate plant diversity. Fingerprinting of bacterial and fungal communities was obtained by examining terminal restriction fragment length polymorphisms (TRFLP) of PCR-amplified of bacterial 16S rDNA gene and fungal ITS (Internal Transcribed Space) region from rDNA extracted from soil samples. This molecular technique has been widely used to describe the structure and diversity of these soil communities (e.g. Kennedy, Edwards and Clipson 2005; Curiel Yuste et al., 2011). Although the TRFLP technique cannot recognize taxonomic or functional groups, it does facilitate satisfactory replication, thus permitting comparisons between communities’ diversity and structural patterns. We also explored variables that describe the functioning of soil microbial communities (microbial respiration, microbial biomass and metabolic quotient) and other abiotic variables describing the physical–chemical conditions of the uppermost part of the soil profile, such as pH and SOM content.
The specific objectives of the study were as follows.
To analyze the contribution of (i) vegetation type and (ii) climate-induced die-off to the diversity and structure of soil microbial communities, distinguishing between bacterial and fungal communities.
To assess the role of bacterial and fungal diversity in variables related to soil functioning (soil basal and substrate-induced microbial respiration, microbial metabolic quotient), according to (i) vegetation type and (ii) climate-induced die-off.
MATERIAL AND METHODS
Study area
The study was performed in the Doñana National Park in south-western Spain (38°13′ N, 48°10′ W). The site is located approximately 3 km from the Atlantic Ocean on sandy soils derived from a dune field. The parent material of the studied soil is eolian sandy sediment from Holocene covering gravels and sandy sediments from Pliocene–Pleistocene, constituting a system of stabilized dunes (Siljeström and Clement 1990). The main soil types are Typic Xeropsamment (dune tops), Aquic Xeropsamment (dune slopes) and Humaqueptic Psammaquent (inter-dune depressions) (Siljeström et al., 1994). Soil texture composition is dominated by sand (Muñoz-Reinoso and García Novo 2004).
The vegetation consists of wetlands, patches of annual grassland, 1–2 m tall shrubland dominated by Cistaceae (Halimium halimifolium (L.) Willk., H. commutatum Pau, Cistus libanotis L.), Fabaceae (Staurancanthus genistoides (Brot.) Samp, Ulex australis Clemente) and Lamiaceae (Rosmarinus officinalis L., Lavandula stoechas L., Thymus mastichina L.), and locally dense stands of Juniperus phoenicea L. woodland that are often mixed with Pinus pinea L.
The climate is sub-humid Mediterranean with oceanic influence. Mean annual rainfall is 560 mm, with great between-year variability, ranging from 1000 to less than 300 mm. Most rainfall (approximately 80%) falls between October and March, while July and August are normally very dry (García Novo 1979). The mean annual temperature is 16.5ºC, with mean monthly values ranging from 10.0ºC in January to 24.7ºC in July. An episode of extreme drought combined with cold temperature occurred in the hydrological year of October 2004 to September 2005, when total rainfall only achieved 173.0 mm, making it the second driest year since 1859 (see Fig. S1, Supporting Information). Specifically, winter rainfall was only 58.9 mm, less than one third the historical average, while the minimum temperatures in January and February 2005 were 1.1 and 0.9ºC, respectively, considerably below mean values (5.0ºC for January and 6.1ºC for February). This episode produced a general die-off of the perennial vegetation, including shrublands and woodland dominated by J. phoenicea. Annual rainfall recovered its normal values in the years following this episode, ranging from 468.3 mm in the 2005–2006 hydrological period to 784.2 mm in 2009–2010 (Fig. S1, Supporting Information).
Field sampling
The study was performed in three localities within an area of approximately 10 km2: Raposo (N 37º0′2′′ W6º30′20′′), Ojillo (N36º59′45′′ W6º30′40′′) and Marqués (N 37º0′45′′ W6º31′50′′), separated from each other by at least 1 km. The three sites differed slightly in their elevation with respect to the dune field (Raposo was the lowest, at 18 m a.s.l., Marqués the highest, at 30 m a.s.l., and Ojillo in an intermediate position, close to the top, at 21 m a.s.l) and, as a result, they probably differed in their distance from the water table. They are therefore on a natural gradient of water stress. Four sampling points in Raposo and Ojillo and five sampling points in Marqués were selected for each vegetation type (Juniperus woodland, shrubland and grassland) and degree of defoliation—damaged or unaffected—(hereafter, drought impact): damaged and unaffected Juniperus woodland, damaged and unaffected shrubland and grassland (see Fig. S2, Supporting Information). Soil analyses revealed that there were no significant differences in pH between the different habitats, although conductivity was lower in grassland (Table 1). Sampling points of damaged stands showed percentages of dry canopy higher than 50% in relation to total vegetation cover (Table S1, Supporting Information). Given that annuals dominated the grassland, no distinction could be detected between die-off-damaged and unaffected stands. The different sampling points per vegetation type and degree of defoliation were separated from each other by at least 10 m. In May 2010, five years after the drought episode, two 2 m-long perpendicular transects were established at each sampling point; vegetation surveys were then performed by measuring the canopy projection of all the plants above the transects, distinguishing living and dry, recently dead plants (Table 1; see Table S1 (in the Supporting Information) for a detailed information of the location and vegetation composition and state at the sampling points). At this point, vegetation had not yet fully recovered on damaged plots (Fig. S2, Supporting Information), with the percentage of dry canopy with respect to total vegetation cover ranging from 57.5 to 97% (see Table S1, Supporting Information; see also Fig. S3 (in the Supporting Information) for a description of the performance since before 2007 to 2013 of shrubland cover on stands with different degrees of die-off damage). These vegetation surveys performed at sampling-point transects were used to estimate plant diversity (H′ index calculated for all plant species including grasses and woody species) and the abundance of woody species (estimated by the sum of the percentage cover of the different woody species on the transects).
Mean (SE) vegetation and soil properties in the different vegetation types and climate-induced die-off stands. The number of final samples used in the analyses of bacterial and fungal communities is provided in the last two columns. Letters indicate significant differences (one-way ANOVA and pair-wise t-test). Soil variables were log-transformed to attain normality. Defoliated canopy: percentage of defoliation in relation to total canopy cover, estimated in woody stands; H′: Shannon diversity index; SOM: soil organic matter, BR: basal soil respiration, SIR: substrate-induced soil respiration, MBC: microbial biomass carbon, qCO2: microbial metabolic quotient.
| Defoliated canopy (%) | Vegetation richness | Vegetation H′ | pH | Conductivity (mS cm−1) | SOM (%) | BR (mg CO2 kg−1·h) | SIR (mg CO2 kg−1·h) | MBC (mg C g−1) | qCO2 | Bacteria samples | Fungi samples | |
|---|---|---|---|---|---|---|---|---|---|---|---|---|
| Unaffected Juniperus woodland | 0.83 a (0.61) | 5.69 a (0.60) | 0.53 c (0.08) | 6.50 a (0.08) | 159.7 a (16.1) | 2.06 a (0.15) | 6.1 ab (1.05) | 10.1 a (1.2) | 74.6 a (15.3) | 0.121 ab (0.029) | 11 | 8 |
| Die-off Juniperus woodland | 82.7 b (2.89) | 8.23 b (0.91) | 1.55 a (0.09) | 6.41 a (0.07) | 143.7 a (13.9) | 2.22 a (0.16) | 8.39 bc (1.11) | 18.5 bc (1.9) | 72.7 a (10.1) | 0.131 ab (0.030) | 14 | 11 |
| Unaffected shrubland | 6.6 a (3.18) | 8.46 b (1.06) | 1.19 b (0.10) | 6.33 a (0.08) | 115.4 ab (18.0) | 2.09 a (0.22) | 4.73 a (1.06) | 9.7 a (1.0) | 63.4 a (11.6) | 0.101 a (0.111) | 11 | 13 |
| Die-off shrubland | 79.2 b (3.18) | 9.0 b (0.75) | 1.67 a (0.13) | 6.48 a (0.10) | 105.6 ab (7.9) | 1.60 b (0.12) | 8.57 bc (0.94) | 12.7 ab (0.9) | 68.7 a (12.9) | 0.262 b (0.470) | 10 | 12 |
| Grassland | – | 9.5 b (0.61) | 1.59 a (0.07) | 6.38 a (0.11) | 87.7 b (11.9) | 1.86 ab (0.16) | 13.06 c (3.34) | 23.2 c (4.5) | 78.4 a (14.7) | 0.195 ab (0.180) | 13 | 8 |
| Defoliated canopy (%) | Vegetation richness | Vegetation H′ | pH | Conductivity (mS cm−1) | SOM (%) | BR (mg CO2 kg−1·h) | SIR (mg CO2 kg−1·h) | MBC (mg C g−1) | qCO2 | Bacteria samples | Fungi samples | |
|---|---|---|---|---|---|---|---|---|---|---|---|---|
| Unaffected Juniperus woodland | 0.83 a (0.61) | 5.69 a (0.60) | 0.53 c (0.08) | 6.50 a (0.08) | 159.7 a (16.1) | 2.06 a (0.15) | 6.1 ab (1.05) | 10.1 a (1.2) | 74.6 a (15.3) | 0.121 ab (0.029) | 11 | 8 |
| Die-off Juniperus woodland | 82.7 b (2.89) | 8.23 b (0.91) | 1.55 a (0.09) | 6.41 a (0.07) | 143.7 a (13.9) | 2.22 a (0.16) | 8.39 bc (1.11) | 18.5 bc (1.9) | 72.7 a (10.1) | 0.131 ab (0.030) | 14 | 11 |
| Unaffected shrubland | 6.6 a (3.18) | 8.46 b (1.06) | 1.19 b (0.10) | 6.33 a (0.08) | 115.4 ab (18.0) | 2.09 a (0.22) | 4.73 a (1.06) | 9.7 a (1.0) | 63.4 a (11.6) | 0.101 a (0.111) | 11 | 13 |
| Die-off shrubland | 79.2 b (3.18) | 9.0 b (0.75) | 1.67 a (0.13) | 6.48 a (0.10) | 105.6 ab (7.9) | 1.60 b (0.12) | 8.57 bc (0.94) | 12.7 ab (0.9) | 68.7 a (12.9) | 0.262 b (0.470) | 10 | 12 |
| Grassland | – | 9.5 b (0.61) | 1.59 a (0.07) | 6.38 a (0.11) | 87.7 b (11.9) | 1.86 ab (0.16) | 13.06 c (3.34) | 23.2 c (4.5) | 78.4 a (14.7) | 0.195 ab (0.180) | 13 | 8 |
Mean (SE) vegetation and soil properties in the different vegetation types and climate-induced die-off stands. The number of final samples used in the analyses of bacterial and fungal communities is provided in the last two columns. Letters indicate significant differences (one-way ANOVA and pair-wise t-test). Soil variables were log-transformed to attain normality. Defoliated canopy: percentage of defoliation in relation to total canopy cover, estimated in woody stands; H′: Shannon diversity index; SOM: soil organic matter, BR: basal soil respiration, SIR: substrate-induced soil respiration, MBC: microbial biomass carbon, qCO2: microbial metabolic quotient.
| Defoliated canopy (%) | Vegetation richness | Vegetation H′ | pH | Conductivity (mS cm−1) | SOM (%) | BR (mg CO2 kg−1·h) | SIR (mg CO2 kg−1·h) | MBC (mg C g−1) | qCO2 | Bacteria samples | Fungi samples | |
|---|---|---|---|---|---|---|---|---|---|---|---|---|
| Unaffected Juniperus woodland | 0.83 a (0.61) | 5.69 a (0.60) | 0.53 c (0.08) | 6.50 a (0.08) | 159.7 a (16.1) | 2.06 a (0.15) | 6.1 ab (1.05) | 10.1 a (1.2) | 74.6 a (15.3) | 0.121 ab (0.029) | 11 | 8 |
| Die-off Juniperus woodland | 82.7 b (2.89) | 8.23 b (0.91) | 1.55 a (0.09) | 6.41 a (0.07) | 143.7 a (13.9) | 2.22 a (0.16) | 8.39 bc (1.11) | 18.5 bc (1.9) | 72.7 a (10.1) | 0.131 ab (0.030) | 14 | 11 |
| Unaffected shrubland | 6.6 a (3.18) | 8.46 b (1.06) | 1.19 b (0.10) | 6.33 a (0.08) | 115.4 ab (18.0) | 2.09 a (0.22) | 4.73 a (1.06) | 9.7 a (1.0) | 63.4 a (11.6) | 0.101 a (0.111) | 11 | 13 |
| Die-off shrubland | 79.2 b (3.18) | 9.0 b (0.75) | 1.67 a (0.13) | 6.48 a (0.10) | 105.6 ab (7.9) | 1.60 b (0.12) | 8.57 bc (0.94) | 12.7 ab (0.9) | 68.7 a (12.9) | 0.262 b (0.470) | 10 | 12 |
| Grassland | – | 9.5 b (0.61) | 1.59 a (0.07) | 6.38 a (0.11) | 87.7 b (11.9) | 1.86 ab (0.16) | 13.06 c (3.34) | 23.2 c (4.5) | 78.4 a (14.7) | 0.195 ab (0.180) | 13 | 8 |
| Defoliated canopy (%) | Vegetation richness | Vegetation H′ | pH | Conductivity (mS cm−1) | SOM (%) | BR (mg CO2 kg−1·h) | SIR (mg CO2 kg−1·h) | MBC (mg C g−1) | qCO2 | Bacteria samples | Fungi samples | |
|---|---|---|---|---|---|---|---|---|---|---|---|---|
| Unaffected Juniperus woodland | 0.83 a (0.61) | 5.69 a (0.60) | 0.53 c (0.08) | 6.50 a (0.08) | 159.7 a (16.1) | 2.06 a (0.15) | 6.1 ab (1.05) | 10.1 a (1.2) | 74.6 a (15.3) | 0.121 ab (0.029) | 11 | 8 |
| Die-off Juniperus woodland | 82.7 b (2.89) | 8.23 b (0.91) | 1.55 a (0.09) | 6.41 a (0.07) | 143.7 a (13.9) | 2.22 a (0.16) | 8.39 bc (1.11) | 18.5 bc (1.9) | 72.7 a (10.1) | 0.131 ab (0.030) | 14 | 11 |
| Unaffected shrubland | 6.6 a (3.18) | 8.46 b (1.06) | 1.19 b (0.10) | 6.33 a (0.08) | 115.4 ab (18.0) | 2.09 a (0.22) | 4.73 a (1.06) | 9.7 a (1.0) | 63.4 a (11.6) | 0.101 a (0.111) | 11 | 13 |
| Die-off shrubland | 79.2 b (3.18) | 9.0 b (0.75) | 1.67 a (0.13) | 6.48 a (0.10) | 105.6 ab (7.9) | 1.60 b (0.12) | 8.57 bc (0.94) | 12.7 ab (0.9) | 68.7 a (12.9) | 0.262 b (0.470) | 10 | 12 |
| Grassland | – | 9.5 b (0.61) | 1.59 a (0.07) | 6.38 a (0.11) | 87.7 b (11.9) | 1.86 ab (0.16) | 13.06 c (3.34) | 23.2 c (4.5) | 78.4 a (14.7) | 0.195 ab (0.180) | 13 | 8 |
Soil samples were collected from the upper 10 cm of the soil profile, excluding litter. At each sampling point a circle was drawn, with the two perpendicular transects as diameters. Soil samples were then collected at the center of the four circle quadrants defined by transects. The four soil collections from each sampling point were pooled to obtain a 150–200 g soil sample, which was sealed in a plastic bag and kept at 4ºC. Twelve replicates were then obtained per vegetation type and die-off treatment, four of which corresponded to each locality. After sampling, the soils were sieved (< 2mm) and homogenized. An aliquot of each sample was stored at −20ºC for molecular analysis and another aliquot was stored at 4ºC until the assays of soil microbial biomass carbon (MBC) and basal respiration and SIR were performed.
Soil analysis
The percentage of SOM was estimated as ignition loss (550°C for 2 h) following Nelson and Sommers (1982). Electrical conductivity and soil pH were measured at soil water ratios of 1:5 and 1:2.5, respectively.
Soil functioning was assessed by focusing on decomposition via several related parameters: basal microbial respiration (BR), SIR and microbial metabolic quotient (qCO2). BR was determined by placing 30 g of soil in hermetic glass jars (1000 mL) together with 10 mL 0.05N NaOH in 20 mL glass vials. All samples were incubated for five days at 22.5°C, and the CO2 that evolved and was trapped during the period was determined by titration of the NaOH with 0.1N HCl (Anderson 1982). SIR was measured for 12 consecutive hours, adding the amount of glucose necessary for eliciting maximum respiratory activity (2, 5 and 8 g glucose kg−1 soil were previously recorded). CO2 release was measured as described above. qCO2 was calculated as the ratio between basal respiration and MBC (μg CO2-C g−1 Cmicrh−1).
DNA extraction and microbial communities fingerprinting by TRFLP analysis
Soil DNA was extracted from soil samples using the MoBio Ultraclean DNA Soil Kit (MoBio, Laboratories Inc., CA), as recommended by the manufacturer.
Briefly, the DNA extraction methods involved chemical lysis of microbial cells with gentle bead beating. Released DNA was bound to a silica spin filter that was subsequently washed, and the DNA was recovered in elution buffer solution. DNA yields and quality were checked after electrophoresis in 0.8% (w/v) agarose gel stained with ethidium bromide under UV light (Sambrook, Fritsch and Maniatis 1989). In some cases, we obtained an uninformative TRFLP profile, probably due to a scarce amplification yield; in these cases, samples were discarded for subsequent analyses (see in Table 1 the final number of replicates of each combination of vegetation type and degree of defoliation for both bacteria and fungi).
For bacterial communities, 16S rRNA gene from extracted DNA samples was amplified using the universal eubacterial primers: forward primer 8F (AGAGTTTGATCCTGGCTCAG), labeled with fluorescent dye 6FAM (Applied BioSystem), and reverse primer 1398R (ACGGGCGGTGTGTACAAG).
Fungal DNA was amplified using the highly conserved fungal rRNA gene primers ITS 1-F (CTTGGTCATTTAGAGGAAGTAA), labeled with 6FAM (Applied BioSystem), and ITSF4 (TCCTCCGCTTATTGATATGC).
PCR reaction was performed in 25 μl PCR Master Mix by Promega (containing 50 units mL−1 Taq DNA polymerase in a proprietary reaction buffer, 400 μM each dNTP and 3 mM MgCl2), 0.2 μM of each primer and 1 μl of template DNA.
The thermocycling conditions for bacterial DNA were as follows: a hot start at 95°C for 3 min (one cycle); 95°C for 30 sec, 58°C for 30 sec, 72°C for 1min (35 cycles), and a final extension at 72°C for 7 min.
The thermocycling conditions for fungal DNA were as follows: a hot start at 94°C for 4 min (one cycle); 94°C for 1 min, 55°C for 1 min, 72°C for 2min (40 cycles), with a final extension at 72°C for 7 min. PCR products of the correct size (∼1380 and 700 bp for bacterial and fungal primers, respectively) were confirmed by 1.5% (w/v) agarose gel electrophoresis and subsequently purified using UltraClean® PCR Clean-Up Kit (MoBio Laboratories Inc., CA), according to the manufacturer's instructions (50 μl final volume). The purified PCR product (30 μl) was then digested with 2U of MspI restriction enzymes (Biolabs) in the manufacturer's buffer (total reaction volume 50 μl) overnight at 37ºC. Excess primers and amplification and digestion reagents were removed by precipitating with 5 μl of 125 mM EDTA and 5 μl of 3M NaOAc (pH5.2) and 125 μl 100% ethanol. After centrifugation, the pellet was washed in 70% ethanol, dried and suspended in 10 μl of deionized formamide and 0.25 μl of size standard GeneScan 500-Rox (Applied Biosystem) was added. Samples were denatured for 4 min at 95ºC and analyzed using an automated sequencer ABI Prism 3100 Genetic Analyzer (Applied Biosystem). Size and intensity of data were assessed using Peak Scanner software (Applied Biosystem). For bacteria, peaks corresponding to the range of 50 to 700 bp were considered, and for fungi this range was 50 to 500 bp. Noise filter was carried out with the online software T-REX (Culman et al., 2009): only peaks with a height exceeding a value equivalent to the standard deviation (assuming zero mean) of the whole set of peaks were included in further analysis (Abdo et al., 2006). From our experience, and according to criteria used in previous studies using ABI 3100 (and the preceding version), the error in determining fragment sizes with our ABI 3100 automated DNA sequencer was less than 0.5 bp (Curiel Yuste et al., 2011), and typically less than 0.2 bp. For this reason, we used the criterion of 0.5 bp alignment. The remaining TRFs in different profiles varying in size by 0.5 bp or less were considered the same and were aligned using the moving average algorithm of the software program T-REX (Culman et al., 2009). TRF do not strictly correspond to taxa but they are recognized as providing a consistent proxy for estimating structural characteristics of the microbial communities (e.g. Curiel Yuste et al., 2011; Storey et al., 2014). Therefore, the soil TRF richness of each sample was calculated as the total number of distinct TRF sizes in a profile and H′ and evenness diversity indexes (Magurran 2004) were calculated considering peak area as an estimation of abundance. The evenness index was calculated as the quotient between the observed H′ and the log2 of richness.
Data analysis
General linear models (GLMs) were used to analyze factors contributing to (1) soil microbial diversity and composition, and (2) parameters describing microbial community functioning (Table S2, Supporting Information).
Microbial diversity was estimated separately for bacteria and fungi using richness, evenness and H′ as response variables. Microbial community composition was characterized by PCA (uncentered and unscaled) carried out with the values of the TRF peaks. The first axis of these PCA was used as an overall description of microbial communities. Only peaks that were present in at least 20% of the samples (259 out a total of 637 in bacteria and 48 out a total of 456 in fungi) were considered. This ordination was appropriate, given the short environmental gradient considered and the selection of frequent TRF peaks (Leps and Smilauer 2003).
Functioning of the microbial community was analyzed using BR, substrate-induced microbial respiration (SIR) and microbial metabolic quotient (qCO2) as response variables.
Two sets of GLM were performed: the first addressed the relationship between soil microbial communities and vegetation in unaffected areas (hereafter, vegetation model) (see Field Sampling for a more detailed description) and the second aimed to analyze the effect of the die-off (hereafter, die-off model). The full combination of vegetation types (Juniperus woodland, shrubland and grassland) and die-off (unaffected, damaged) could not be built because no effect of the drought episode was observable on grassland at the sampling time. Thus, the vegetation model considered the three types of vegetation, while the drought model did not include grassland. In addition to vegetation type and die-off, the explicative variables included in the models were plant diversity (H′), abundance of woody species (estimated by the sum of the percentage cover of the different woody species on the transects), SOM and location. In the vegetation model, the interaction between vegetation type and SOM was included. In the die-off model, the interactions between vegetation type and die-off and SOM, and the interactions between die-off and SOM were also included [see Table S2 (in the Supporting Information) for a detailed description of models]. Since vegetation type and plant species diversity are correlated, GLM that excluded plant species diversity while maintaining vegetation type as an explicative variable were also performed.
The analysis of the functioning parameters was similar but included as explicative variables vegetation type, bacterial and fungal diversity, interactions between bacterial and fungal diversity and vegetation type, SOM, MBC, and location in the vegetation model. Different models were built for the three different indicators of microbial diversity: richness, evenness and H′. In the die-off models, die-off and its respective interactions with bacterial and fungal diversity and vegetation type were included. MBC was excluded from the models analyzing microbial metabolic quotient since these variables are inversely correlated.
In these GLM, fungal richness, abundance of woody species, BR, SIR, qCO2, SOM and MBC were log-transformed to attain normality. Model selection was carried out through a step-wise selection procedure using the Aikake information criterion (AIC) to select the best-fitted models. No-significant factors (high p-values) remained in the models when their interaction with other factors was significant. Categorical variables were coded hierarchically after splitting the levels into two groups as indicated in tables by brackets and the successive significant variables consisting of each set of two groups were then included in the model. All the GLM analyses were performed using JMP 10.0 (SAS Institute Inc.).
Differences in pH, conductivity, SOM and MBC between the five vegetation categories, including damaged stands of Juniperus woodland and shrubland, were estimated by one-way ANOVA and post-hoc pairwise t-tests. All these variables were log-transformed to attain normality.
RESULTS
Bacterial community
More bacterial TRFs were obtained than fungal ones in all the habitats (Fig. 1). In unaffected stands, bacteria richness was explained in models by increasing plant diversity and decreasing SOM (Fig. 2; Table S3, Supporting Information). This effect of plant diversity was strongly related to vegetation type, because in the GLM that excluded plant diversity, vegetation type exhibited a significant effect, while AIC retained a similar value (Table S3, Supporting Information). The highest bacterial richness was found in grasslands—the habitat with the highest vegetation diversity (one-way ANOVA, F = 41.53, P < 0.001)—and the lowest in Juniperus woodland (Fig. 1). Bacterial evenness was also determined by plant diversity and vegetation type (Table S3, Supporting Information). In this case, the relationship was negative: the lowest evenness was found in grassland and the highest in Juniperus woodland (Fig. 1). Accordingly, bacterial H′ was determined by vegetation type, with the highest values in grassland and the lowest in Juniperus woodland (Fig. 1). Bacterial composition, estimated from the first axis of PCA, was determined by vegetation type in unaffected stands and by die-off in damaged ones (Table S4, Supporting Information). Accordingly, the PCA scores of plots demonstrated distinct values for unaffected and damaged stands of Juniperus woodland (Fig. 3).
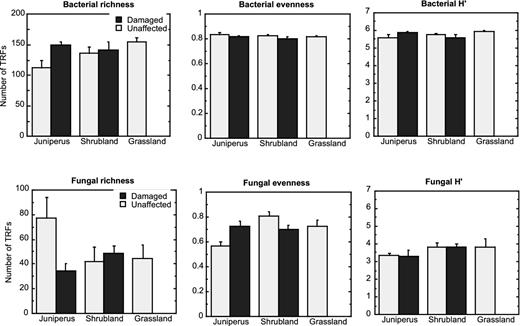
Mean (SE) bacterial and fungal diversity in different vegetation types and with different climate-induced die-off.

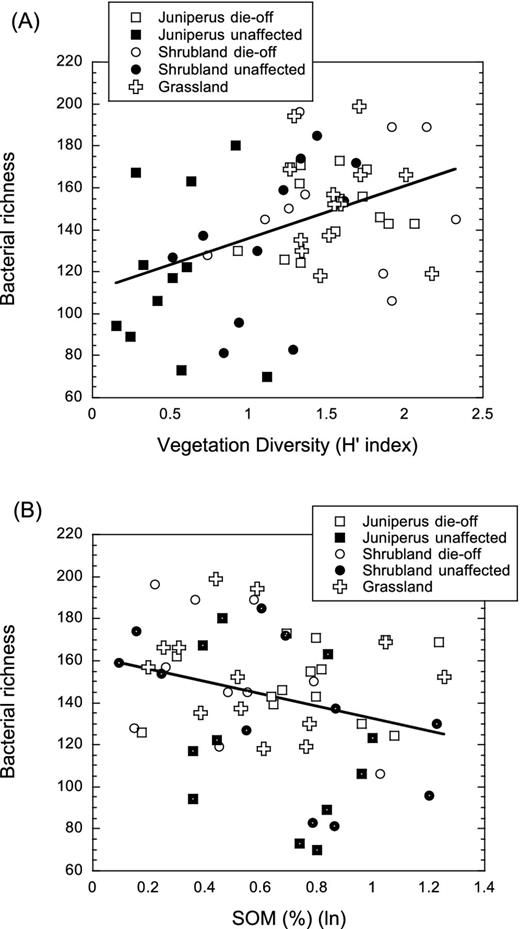
Relationship between bacterial richness (number of TRF peaks) and (A) vegetation diversity estimated as the H′ index and (B) SOM (%) in the five studied habitats. Linear fit for the whole set of data is shown in (a) (r2 = 0.18, P = 0.001) and (b) (r2 = 0.08, P = 0.030).

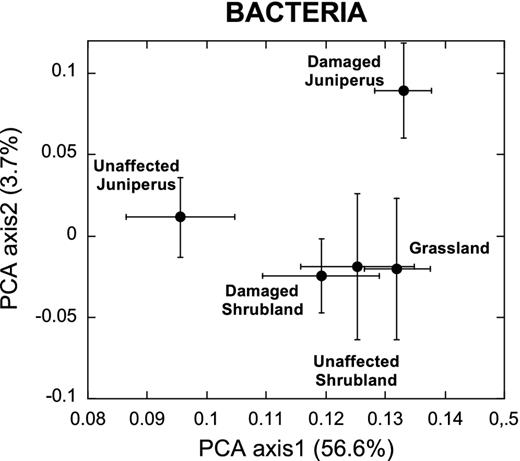
Mean coordinates of the first and second axes of PCAs performed for bacteria TRFs peaks (log-transformed) from the samples of each vegetation type. Error bars indicate SE. Percentage of variability explained by each axe is given in brackets.

In damaged stands, bacterial richness also related positively to plant diversity and negatively to SOM (Fig. 2; Table 4). Die-off had a significant effect on bacterial richness in the model excluding vegetation diversity (Table 2): richness increased in damaged stands, particularly in Juniperus woodland (Fig. 1). This increase concurred with higher vegetation richness in affected plots of Juniperus woodland (Table 1). Bacterial evenness was negatively determined by vegetation diversity, and in the model excluding vegetation diversity the significant factors were vegetation type (with lowest values in shrubland), die-off (with lowest values in damaged stands) and locality (Table 2).
Models analyzing bacterial diversity in relation to climate-induced die-off (die-off model). These models were only applied in Juniperus woodlands and shrubland. Only factors contributing to the final, selected model are shown; other factors did not show statistical significance. Results from full models and models excluding vegetation diversity are shown (see the section ‘Material and Methods’). Categorical variables were coded hierarchically after splitting the levels in two groups, as indicated by brackets (see the section ‘Material and Methods’). H′: Shannon diversity index; SOM: soil organic matter; R: Raposo; M: Marques; O: Ojillo; J: Juniperus woodland, S. Shrubland.
| Die-off model | ||||||
|---|---|---|---|---|---|---|
| Richness | Evenness | H′ | ||||
| Full model | ||||||
| AIC | 444.59 | −186.09 | 15.87 | |||
| p | <0.001 | <0.001 | 0.058 | |||
| r2 | 0.279 | 0.248 | 0.079 | |||
| Model terms | est | p | est | p | est | p |
| Locality ([R,M],O) | – | – | – | – | P = 0.058 | P = 0.058 |
| SOM | −30.72 | 0.032 | – | – | – | – |
| Vegetation diversity | 25.85 | 0.002 | −0.031 | <0.001 | – | – |
| Without vegetation diversity | ||||||
| AIC | 448.32 | −182.86 | 15.29 | |||
| p | 0.005 | 0.003 | 0.058 | |||
| r2 | 0.218 | 0.275 | 0.079 | |||
| Model terms | est | p | est | p | est | p |
| Locality (R,[M,O]) | – | – | −0.009 | 0.083 | P = 0.058 | P = 0.058 |
| Vegetation (J,S) | – | – | 0.009 | 0.048 | – | – |
| Die-off | 11.78 | 0.010 | −0.014 | 0.004 | – | – |
| SOM | −30.75 | 0.039 | – | – | – | – |
| Die-off model | ||||||
|---|---|---|---|---|---|---|
| Richness | Evenness | H′ | ||||
| Full model | ||||||
| AIC | 444.59 | −186.09 | 15.87 | |||
| p | <0.001 | <0.001 | 0.058 | |||
| r2 | 0.279 | 0.248 | 0.079 | |||
| Model terms | est | p | est | p | est | p |
| Locality ([R,M],O) | – | – | – | – | P = 0.058 | P = 0.058 |
| SOM | −30.72 | 0.032 | – | – | – | – |
| Vegetation diversity | 25.85 | 0.002 | −0.031 | <0.001 | – | – |
| Without vegetation diversity | ||||||
| AIC | 448.32 | −182.86 | 15.29 | |||
| p | 0.005 | 0.003 | 0.058 | |||
| r2 | 0.218 | 0.275 | 0.079 | |||
| Model terms | est | p | est | p | est | p |
| Locality (R,[M,O]) | – | – | −0.009 | 0.083 | P = 0.058 | P = 0.058 |
| Vegetation (J,S) | – | – | 0.009 | 0.048 | – | – |
| Die-off | 11.78 | 0.010 | −0.014 | 0.004 | – | – |
| SOM | −30.75 | 0.039 | – | – | – | – |
Models analyzing bacterial diversity in relation to climate-induced die-off (die-off model). These models were only applied in Juniperus woodlands and shrubland. Only factors contributing to the final, selected model are shown; other factors did not show statistical significance. Results from full models and models excluding vegetation diversity are shown (see the section ‘Material and Methods’). Categorical variables were coded hierarchically after splitting the levels in two groups, as indicated by brackets (see the section ‘Material and Methods’). H′: Shannon diversity index; SOM: soil organic matter; R: Raposo; M: Marques; O: Ojillo; J: Juniperus woodland, S. Shrubland.
| Die-off model | ||||||
|---|---|---|---|---|---|---|
| Richness | Evenness | H′ | ||||
| Full model | ||||||
| AIC | 444.59 | −186.09 | 15.87 | |||
| p | <0.001 | <0.001 | 0.058 | |||
| r2 | 0.279 | 0.248 | 0.079 | |||
| Model terms | est | p | est | p | est | p |
| Locality ([R,M],O) | – | – | – | – | P = 0.058 | P = 0.058 |
| SOM | −30.72 | 0.032 | – | – | – | – |
| Vegetation diversity | 25.85 | 0.002 | −0.031 | <0.001 | – | – |
| Without vegetation diversity | ||||||
| AIC | 448.32 | −182.86 | 15.29 | |||
| p | 0.005 | 0.003 | 0.058 | |||
| r2 | 0.218 | 0.275 | 0.079 | |||
| Model terms | est | p | est | p | est | p |
| Locality (R,[M,O]) | – | – | −0.009 | 0.083 | P = 0.058 | P = 0.058 |
| Vegetation (J,S) | – | – | 0.009 | 0.048 | – | – |
| Die-off | 11.78 | 0.010 | −0.014 | 0.004 | – | – |
| SOM | −30.75 | 0.039 | – | – | – | – |
| Die-off model | ||||||
|---|---|---|---|---|---|---|
| Richness | Evenness | H′ | ||||
| Full model | ||||||
| AIC | 444.59 | −186.09 | 15.87 | |||
| p | <0.001 | <0.001 | 0.058 | |||
| r2 | 0.279 | 0.248 | 0.079 | |||
| Model terms | est | p | est | p | est | p |
| Locality ([R,M],O) | – | – | – | – | P = 0.058 | P = 0.058 |
| SOM | −30.72 | 0.032 | – | – | – | – |
| Vegetation diversity | 25.85 | 0.002 | −0.031 | <0.001 | – | – |
| Without vegetation diversity | ||||||
| AIC | 448.32 | −182.86 | 15.29 | |||
| p | 0.005 | 0.003 | 0.058 | |||
| r2 | 0.218 | 0.275 | 0.079 | |||
| Model terms | est | p | est | p | est | p |
| Locality (R,[M,O]) | – | – | −0.009 | 0.083 | P = 0.058 | P = 0.058 |
| Vegetation (J,S) | – | – | 0.009 | 0.048 | – | – |
| Die-off | 11.78 | 0.010 | −0.014 | 0.004 | – | – |
| SOM | −30.75 | 0.039 | – | – | – | – |
Models analyzing fungal diversity in relation to climate-induced die-off (only for Juniperus woodlands and shrubland) (die-off model). Categorical variables were coded hierarchically after splitting the levels in two groups, as indicated by brackets (see the section ‘Material and Methods’). Only factors contributing to the selected final model are shown; other factors did not show statistical significance. H′: Shannon diversity index; SOM: soil organic matter; J: Juniperus woodland, S. Shrubland.
| Die-off model | ||||||
|---|---|---|---|---|---|---|
| Richness | Evenness | H′ | ||||
| AIC | 102.05 | −52.19 | 84.09 | |||
| p | 0.015 | <0.001 | <0.001 | |||
| r2 | 0.300 | 0.393 | 0.469 | |||
| Model terms | est | p | est | p | est | p |
| Vegetation (J,S) | 0.004 | 0.971 | −0.069 | <0.001 | −0.383 | 0.002 |
| Die-off | −0.108 | 0.323 | 0.006 | 0.722 | 0.012 | 0.895 |
| SOM | 0.339 | 0.323 | 0.109 | 0.067 | 0.68 | 0.019 |
| Die-off × SOM | 0.937 | 0.010 | 1.35 | <0.001 | ||
| Vegetation (J,S) × die-off | −0.356 | 0.003 | 0.048 | 0.015 | – | – |
| Die-off model | ||||||
|---|---|---|---|---|---|---|
| Richness | Evenness | H′ | ||||
| AIC | 102.05 | −52.19 | 84.09 | |||
| p | 0.015 | <0.001 | <0.001 | |||
| r2 | 0.300 | 0.393 | 0.469 | |||
| Model terms | est | p | est | p | est | p |
| Vegetation (J,S) | 0.004 | 0.971 | −0.069 | <0.001 | −0.383 | 0.002 |
| Die-off | −0.108 | 0.323 | 0.006 | 0.722 | 0.012 | 0.895 |
| SOM | 0.339 | 0.323 | 0.109 | 0.067 | 0.68 | 0.019 |
| Die-off × SOM | 0.937 | 0.010 | 1.35 | <0.001 | ||
| Vegetation (J,S) × die-off | −0.356 | 0.003 | 0.048 | 0.015 | – | – |
Models analyzing fungal diversity in relation to climate-induced die-off (only for Juniperus woodlands and shrubland) (die-off model). Categorical variables were coded hierarchically after splitting the levels in two groups, as indicated by brackets (see the section ‘Material and Methods’). Only factors contributing to the selected final model are shown; other factors did not show statistical significance. H′: Shannon diversity index; SOM: soil organic matter; J: Juniperus woodland, S. Shrubland.
| Die-off model | ||||||
|---|---|---|---|---|---|---|
| Richness | Evenness | H′ | ||||
| AIC | 102.05 | −52.19 | 84.09 | |||
| p | 0.015 | <0.001 | <0.001 | |||
| r2 | 0.300 | 0.393 | 0.469 | |||
| Model terms | est | p | est | p | est | p |
| Vegetation (J,S) | 0.004 | 0.971 | −0.069 | <0.001 | −0.383 | 0.002 |
| Die-off | −0.108 | 0.323 | 0.006 | 0.722 | 0.012 | 0.895 |
| SOM | 0.339 | 0.323 | 0.109 | 0.067 | 0.68 | 0.019 |
| Die-off × SOM | 0.937 | 0.010 | 1.35 | <0.001 | ||
| Vegetation (J,S) × die-off | −0.356 | 0.003 | 0.048 | 0.015 | – | – |
| Die-off model | ||||||
|---|---|---|---|---|---|---|
| Richness | Evenness | H′ | ||||
| AIC | 102.05 | −52.19 | 84.09 | |||
| p | 0.015 | <0.001 | <0.001 | |||
| r2 | 0.300 | 0.393 | 0.469 | |||
| Model terms | est | p | est | p | est | p |
| Vegetation (J,S) | 0.004 | 0.971 | −0.069 | <0.001 | −0.383 | 0.002 |
| Die-off | −0.108 | 0.323 | 0.006 | 0.722 | 0.012 | 0.895 |
| SOM | 0.339 | 0.323 | 0.109 | 0.067 | 0.68 | 0.019 |
| Die-off × SOM | 0.937 | 0.010 | 1.35 | <0.001 | ||
| Vegetation (J,S) × die-off | −0.356 | 0.003 | 0.048 | 0.015 | – | – |
Models analyzing soil respiration in stands of Juniperus woodlands and shrubland subjected to climate-induced die-off. Different models were built for the three indicators of diversity: richness, evenness and H′. Categorical variables were coded hierarchically after splitting the levels in two groups, as indicated by brackets (see the section ‘Material and Methods’). Only factors contributing to the selected final model are shown; other factors did not show statistical significance. For a given respiration variable, when microbial diversity was not significant, the models converged to the same result, and we use a common column heading. Rich: richness; Even: evenness, H′: Shannon diversity index; SOM: soil organic matter; R: Raposo; M: Marques; O: Ojillo.
| Substrate-induced soil rspiration (SIR) | Basal soil respiration (BR) | Microbial metabolic quotient (qCO2) | ||||||||||||||||
|---|---|---|---|---|---|---|---|---|---|---|---|---|---|---|---|---|---|---|
| Rich | Even | H′ | Rich | Even | H′ | Rich | Even | H′ | ||||||||||
| AIC | 27.9 | 35.3 | 29.6 | 79.5 | 80.8 | 64.6 | 67.6 | 66.1 | 67.7 | |||||||||
| r2 | 0.603 | 0.591 | 0.564 | 0.444 | 0.429 | 0.423 | 0.622 | 0.650 | 0.614 | |||||||||
| p | <0.001 | <0.001 | <0.001 | <0.001 | <0.001 | <0.001 | <0.001 | <0.001 | <0.001 | |||||||||
| Model terms | est | p | est | p | est | p | est | p | est | p | est | p | est | p | est | p | est | p |
| Locality (R,[M,O] | −0.150 | 0.007 | −0.173 | 0.007 | −0.178 | 0.004 | −0.152 | 0.093 | – | – | – | – | −0.147 | 0.133 | – | – | – | – |
| Locality (R) | – | – | – | – | – | – | – | – | −0.331 | 0.011 | −0.305 | 0.019 | – | – | −0.272 | 0.056 | 0.289 | 0.04 |
| Locality (M) | – | – | – | – | – | – | – | – | −0.006 | 0.747 | −0.036 | 0.954 | – | – | −0.065 | 0.578 | 0.044 | 0.716 |
| Die-off | 0.323 | <0.001 | 0.281 | <0.001 | 0.269 | <0.001 | 0.449 | <0.001 | 0.417 | <0.001 | 0.39 | <0.001 | 0.461 | <0.001 | 0.392 | <0.001 | 0.393 | <0.001 |
| Vegetation | 0.062 | 0.196 | 0.091 | 0.107 | 0.102 | 0.005 | – | – | −0.022 | 0.791 | – | – | – | – | – | – | – | – |
| Bacterial diversity | −0.006 | <0.001 | 0.853 | 0.615 | −0.580 | 0.004 | −0.008 | 0.007 | 3.040 | 0.252 | −0.720 | 0.025 | −0.008 | 0.009 | 2.540 | 0.353 | 0.700 | 0.037 |
| Microbial biomass C | – | – | −0.145 | 0.081 | – | – | – | – | – | – | – | – | −1.030 | <0.001 | −1.010 | <0.001 | 1.020 | <0.001 |
| Die-off × bacterial diversity | – | – | −3.65 | 0.046 | – | – | – | – | −7.180 | 0.007 | – | – | – | – | – | – | – | – |
| Vegetation × bacterial diversity | – | – | 4.32 | 0.018 | – | – | – | – | 5.11 | 0.036 | – | – | – | – | −7.490 | 0.010 | – | – |
| Vegetation × die-off | 0.157 | 0.003 | 0.219 | <0.001 | 0.154 | 0.005 | – | – | – | – | – | – | – | – | – | – | – | – |
| Substrate-induced soil rspiration (SIR) | Basal soil respiration (BR) | Microbial metabolic quotient (qCO2) | ||||||||||||||||
|---|---|---|---|---|---|---|---|---|---|---|---|---|---|---|---|---|---|---|
| Rich | Even | H′ | Rich | Even | H′ | Rich | Even | H′ | ||||||||||
| AIC | 27.9 | 35.3 | 29.6 | 79.5 | 80.8 | 64.6 | 67.6 | 66.1 | 67.7 | |||||||||
| r2 | 0.603 | 0.591 | 0.564 | 0.444 | 0.429 | 0.423 | 0.622 | 0.650 | 0.614 | |||||||||
| p | <0.001 | <0.001 | <0.001 | <0.001 | <0.001 | <0.001 | <0.001 | <0.001 | <0.001 | |||||||||
| Model terms | est | p | est | p | est | p | est | p | est | p | est | p | est | p | est | p | est | p |
| Locality (R,[M,O] | −0.150 | 0.007 | −0.173 | 0.007 | −0.178 | 0.004 | −0.152 | 0.093 | – | – | – | – | −0.147 | 0.133 | – | – | – | – |
| Locality (R) | – | – | – | – | – | – | – | – | −0.331 | 0.011 | −0.305 | 0.019 | – | – | −0.272 | 0.056 | 0.289 | 0.04 |
| Locality (M) | – | – | – | – | – | – | – | – | −0.006 | 0.747 | −0.036 | 0.954 | – | – | −0.065 | 0.578 | 0.044 | 0.716 |
| Die-off | 0.323 | <0.001 | 0.281 | <0.001 | 0.269 | <0.001 | 0.449 | <0.001 | 0.417 | <0.001 | 0.39 | <0.001 | 0.461 | <0.001 | 0.392 | <0.001 | 0.393 | <0.001 |
| Vegetation | 0.062 | 0.196 | 0.091 | 0.107 | 0.102 | 0.005 | – | – | −0.022 | 0.791 | – | – | – | – | – | – | – | – |
| Bacterial diversity | −0.006 | <0.001 | 0.853 | 0.615 | −0.580 | 0.004 | −0.008 | 0.007 | 3.040 | 0.252 | −0.720 | 0.025 | −0.008 | 0.009 | 2.540 | 0.353 | 0.700 | 0.037 |
| Microbial biomass C | – | – | −0.145 | 0.081 | – | – | – | – | – | – | – | – | −1.030 | <0.001 | −1.010 | <0.001 | 1.020 | <0.001 |
| Die-off × bacterial diversity | – | – | −3.65 | 0.046 | – | – | – | – | −7.180 | 0.007 | – | – | – | – | – | – | – | – |
| Vegetation × bacterial diversity | – | – | 4.32 | 0.018 | – | – | – | – | 5.11 | 0.036 | – | – | – | – | −7.490 | 0.010 | – | – |
| Vegetation × die-off | 0.157 | 0.003 | 0.219 | <0.001 | 0.154 | 0.005 | – | – | – | – | – | – | – | – | – | – | – | – |
Models analyzing soil respiration in stands of Juniperus woodlands and shrubland subjected to climate-induced die-off. Different models were built for the three indicators of diversity: richness, evenness and H′. Categorical variables were coded hierarchically after splitting the levels in two groups, as indicated by brackets (see the section ‘Material and Methods’). Only factors contributing to the selected final model are shown; other factors did not show statistical significance. For a given respiration variable, when microbial diversity was not significant, the models converged to the same result, and we use a common column heading. Rich: richness; Even: evenness, H′: Shannon diversity index; SOM: soil organic matter; R: Raposo; M: Marques; O: Ojillo.
| Substrate-induced soil rspiration (SIR) | Basal soil respiration (BR) | Microbial metabolic quotient (qCO2) | ||||||||||||||||
|---|---|---|---|---|---|---|---|---|---|---|---|---|---|---|---|---|---|---|
| Rich | Even | H′ | Rich | Even | H′ | Rich | Even | H′ | ||||||||||
| AIC | 27.9 | 35.3 | 29.6 | 79.5 | 80.8 | 64.6 | 67.6 | 66.1 | 67.7 | |||||||||
| r2 | 0.603 | 0.591 | 0.564 | 0.444 | 0.429 | 0.423 | 0.622 | 0.650 | 0.614 | |||||||||
| p | <0.001 | <0.001 | <0.001 | <0.001 | <0.001 | <0.001 | <0.001 | <0.001 | <0.001 | |||||||||
| Model terms | est | p | est | p | est | p | est | p | est | p | est | p | est | p | est | p | est | p |
| Locality (R,[M,O] | −0.150 | 0.007 | −0.173 | 0.007 | −0.178 | 0.004 | −0.152 | 0.093 | – | – | – | – | −0.147 | 0.133 | – | – | – | – |
| Locality (R) | – | – | – | – | – | – | – | – | −0.331 | 0.011 | −0.305 | 0.019 | – | – | −0.272 | 0.056 | 0.289 | 0.04 |
| Locality (M) | – | – | – | – | – | – | – | – | −0.006 | 0.747 | −0.036 | 0.954 | – | – | −0.065 | 0.578 | 0.044 | 0.716 |
| Die-off | 0.323 | <0.001 | 0.281 | <0.001 | 0.269 | <0.001 | 0.449 | <0.001 | 0.417 | <0.001 | 0.39 | <0.001 | 0.461 | <0.001 | 0.392 | <0.001 | 0.393 | <0.001 |
| Vegetation | 0.062 | 0.196 | 0.091 | 0.107 | 0.102 | 0.005 | – | – | −0.022 | 0.791 | – | – | – | – | – | – | – | – |
| Bacterial diversity | −0.006 | <0.001 | 0.853 | 0.615 | −0.580 | 0.004 | −0.008 | 0.007 | 3.040 | 0.252 | −0.720 | 0.025 | −0.008 | 0.009 | 2.540 | 0.353 | 0.700 | 0.037 |
| Microbial biomass C | – | – | −0.145 | 0.081 | – | – | – | – | – | – | – | – | −1.030 | <0.001 | −1.010 | <0.001 | 1.020 | <0.001 |
| Die-off × bacterial diversity | – | – | −3.65 | 0.046 | – | – | – | – | −7.180 | 0.007 | – | – | – | – | – | – | – | – |
| Vegetation × bacterial diversity | – | – | 4.32 | 0.018 | – | – | – | – | 5.11 | 0.036 | – | – | – | – | −7.490 | 0.010 | – | – |
| Vegetation × die-off | 0.157 | 0.003 | 0.219 | <0.001 | 0.154 | 0.005 | – | – | – | – | – | – | – | – | – | – | – | – |
| Substrate-induced soil rspiration (SIR) | Basal soil respiration (BR) | Microbial metabolic quotient (qCO2) | ||||||||||||||||
|---|---|---|---|---|---|---|---|---|---|---|---|---|---|---|---|---|---|---|
| Rich | Even | H′ | Rich | Even | H′ | Rich | Even | H′ | ||||||||||
| AIC | 27.9 | 35.3 | 29.6 | 79.5 | 80.8 | 64.6 | 67.6 | 66.1 | 67.7 | |||||||||
| r2 | 0.603 | 0.591 | 0.564 | 0.444 | 0.429 | 0.423 | 0.622 | 0.650 | 0.614 | |||||||||
| p | <0.001 | <0.001 | <0.001 | <0.001 | <0.001 | <0.001 | <0.001 | <0.001 | <0.001 | |||||||||
| Model terms | est | p | est | p | est | p | est | p | est | p | est | p | est | p | est | p | est | p |
| Locality (R,[M,O] | −0.150 | 0.007 | −0.173 | 0.007 | −0.178 | 0.004 | −0.152 | 0.093 | – | – | – | – | −0.147 | 0.133 | – | – | – | – |
| Locality (R) | – | – | – | – | – | – | – | – | −0.331 | 0.011 | −0.305 | 0.019 | – | – | −0.272 | 0.056 | 0.289 | 0.04 |
| Locality (M) | – | – | – | – | – | – | – | – | −0.006 | 0.747 | −0.036 | 0.954 | – | – | −0.065 | 0.578 | 0.044 | 0.716 |
| Die-off | 0.323 | <0.001 | 0.281 | <0.001 | 0.269 | <0.001 | 0.449 | <0.001 | 0.417 | <0.001 | 0.39 | <0.001 | 0.461 | <0.001 | 0.392 | <0.001 | 0.393 | <0.001 |
| Vegetation | 0.062 | 0.196 | 0.091 | 0.107 | 0.102 | 0.005 | – | – | −0.022 | 0.791 | – | – | – | – | – | – | – | – |
| Bacterial diversity | −0.006 | <0.001 | 0.853 | 0.615 | −0.580 | 0.004 | −0.008 | 0.007 | 3.040 | 0.252 | −0.720 | 0.025 | −0.008 | 0.009 | 2.540 | 0.353 | 0.700 | 0.037 |
| Microbial biomass C | – | – | −0.145 | 0.081 | – | – | – | – | – | – | – | – | −1.030 | <0.001 | −1.010 | <0.001 | 1.020 | <0.001 |
| Die-off × bacterial diversity | – | – | −3.65 | 0.046 | – | – | – | – | −7.180 | 0.007 | – | – | – | – | – | – | – | – |
| Vegetation × bacterial diversity | – | – | 4.32 | 0.018 | – | – | – | – | 5.11 | 0.036 | – | – | – | – | −7.490 | 0.010 | – | – |
| Vegetation × die-off | 0.157 | 0.003 | 0.219 | <0.001 | 0.154 | 0.005 | – | – | – | – | – | – | – | – | – | – | – | – |
Fungal community
Fungal diversity was better explained by our models (between 30 and 53%) than bacterial diversity (less than 30%). In unaffected stands, fungal richness was higher in Juniperus woodland (Fig. 1). Fungal richness displayed an overall humped relationship with SOM (polynomial fit to degree 2, r2 = 0.200, P = 0.005) (Fig. 4a). Accordingly, there was a significant interaction between vegetation type and SOM (Table S4, Supporting Information): fungal richness increased linearly with SOM in grassland (r2 = 0.750, P = 0.012), while there was no significant correlation in shrubland (r2 = 0.110, P = 0.268) and Juniperus woodland (r2 = 0.001, P = 0.950) (Fig. 4a). Fungal evenness was also determined by vegetation type, with lower values in Juniperus woodland (Fig. 1; Table S4, Supporting Information). Fungal H′ showed a relationship with SOM similar to that of richness (Fig. 4b; Table S5, Supporting Information) (polynomial fit to degree 2, r2 = 0.139, P = 0.028; correlation between fungal H′ and SOM in grassland: r2 = 0.562, P = 0.052, in shrubland, r2 = 0.174, P = 0.156, in Juniperus woodland, r2 = 0.084, P = 0.486).
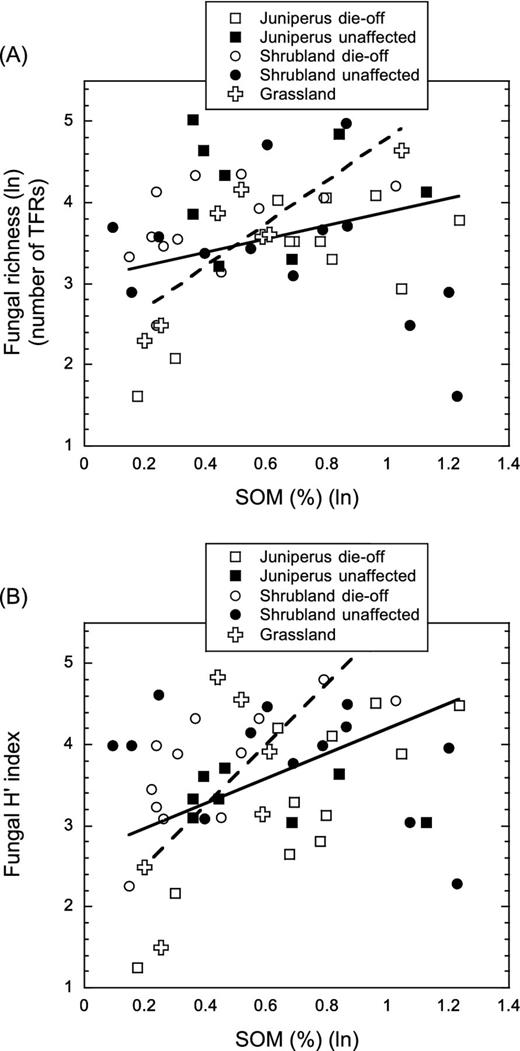
Relationship between fungal diversity and SOM (%): (A) fungal richness (number of TRF peaks) and (B) fungal H′ index, estimated from the area of TRF peaks, and SOM in the five studied habitats. Linear fit for unaffected stands (solid line) (richness, r2 = 0.08, P = 0.210; H′, r2 = 0.09, P = 0.193) and grassland (dashed line) (richness, r2 = 0.75, P = 0.012; H′, r2 = 0.56, P = 0.053) is shown in (a) and (b) to illustrate the results of GLM models (see the text).

In damaged stands, there was a significant interaction between vegetation type and die-off in models analyzing fungal richness (Table 3). Fungal richness decreased with die-off in Juniperus woodland, but not in shrubland (Fig. 1). There was also a significant interaction between die-off and SOM (Table 3): fungal richness was positively but marginally related to SOM in damaged stands (r2 = 0.139, P = 0.079) but not in unaffected ones (r2 = 0.082, P = 0.209) (Fig. 4a). Models analyzing evenness also showed a significant interaction between vegetation type and die-off: evenness increased with die-off in Juniperus woodland and decreased in shrubland. There was also a significant interaction between die-off and SOM (Table 3): H′ increased significantly with SOM in damaged stands (r2 = 0.298, P = 0.007) but not in unaffected ones (r2 = 0.087, P = 0.193) (Fig. 4b).
The first and second axis of the PCA ordinations of fungal composition explained 36.8 and 8.6% of the TRF peak variability, respectively. The GLM of fungal composition estimated by the first PCA axis were poor and did not attain statistical significance.
Soil microbial functional properties
In unaffected stands, microbial respiration (BR, SIR) was explained by locality, vegetation type and bacterial diversity. SIR was negatively correlated to bacterial diversity (H′ index) (r2 = 0.423, P = 0.016) in grassland, explaining the observed significant interaction between vegetation type and bacterial evenness (Table S6, Supporting Information).
In damaged stands, SIR was 1.8 (in Juniperus woodland) and 1.3 (in shrubland) times higher than in unaffected ones. Die-off increased BR 1.4 times in Juniperus woodland and 1.8 times in shrubland (Tables 1 and 4). Accordingly, qCO2 was also higher in damaged stands (Tables 1 and 4), particularly in shrubland, but it was not related to microbial diversity. Both BR and SIR were negatively correlated with bacterial richness and H′. There were significant interactions between bacterial evenness and vegetation type and die-off in the respiration models (Table 4).
Discussion
Microbial diversity and vegetation in unaffected plots
This study corroborated the strong ecological relationship between soil microbial communities and vegetation and showed how this relationship was modified by abrupt weather-induced alterations to the environment. In the absence of die-off, the type of vegetation was an important determinant of the diversity and structure of soil microbial communities. Both processes resulting directly from die-off (i.e. litter fall) and from the following successional replacements (i.e. increase in grasslands species in woody vegetation) contributed to the explanation of the response of soil microbial communities to the climatic events.
Several papers have identified changes in soil microbial communities between vegetation units (Balser and Firestone 2005; Curiel Yuste et al., 2012) or biomes (Fierer et al., 2009; Lauber et al., 2009), and our study corroborated these findings on a small scale between vegetation types coexisting in the same landscape (see also Cregger et al., 2012). Nevertheless, bacterial and fungal diversity responded differently. Under unaffected canopies, there was a gradient towards lower bacterial richness from grassland to Juniperus woodland, which coincided with a similar gradient in plant diversity. The opposite trend in bacterial evenness pointed to changes in the hierarchical structure of the bacterial community, with a large number of rare taxa in more diverse plant communities. Conversely, fungal richness was clearly higher and evenness was lower under Juniperus woodlands. These results concurred with observations of soil microbial communities in the gradient from grasslands to forest (e.g. Imberger and Chiu 2001; Kageyama et al., 2008).
The observed association of bacterial and vegetation diversity can be explained by the ability of plant species to promote different niches for bacteria. Microhabitats under Juniperus woodland were more homogeneous with respect to grasslands, due to a dense canopy that prevented the establishment of other plant species, thus reducing plant richness (Table 1). The differential quality of the substrates provided by plants in these vegetation types is also expected to play a critical role. As in other gymnosperms, Juniperus foliage is rich in monoterpenes and other secondary compounds that have been reported to constrain the development of a rich soil microbiota (Montane et al., 2010; Zhang et al., 2003). Indeed, the decrease in bacterial richness as SOM accumulates in soils (from grassland to shrubland and Juniperus woodland) suggested that bacteria might be sensitive to SOM quality, assuming that this accumulation was partly caused by decreasing degradability of the substrate.
In contrast, the variation in fungal communities, which was better explained by our models than the bacterial one, appeared to be mainly driven by the properties derived from the different vegetation types rather than by plant diversity itself. This is particularly true of the microhabitat created by Juniperus woodlands, where fungal composition and diversity were differentiated, particularly in unaffected stands (Cregger et al., 2012). The richer and more structured fungal community (less evenness) under Juniperus woodlands could be explained by higher levels of mycorrhization under this woody vegetation (Williams et al., 2013). Moreover, the typical recalcitrance of SOM under woody vegetation stands, resulting in high C:N ratios, may have favored the growth of a diverse saprophytic fungal community able to decompose these molecules under Juniperus woodland (Fierer et al., 2009).
Climate-induced die-off and microbial diversity
The weather anomaly affected soil microbial diversity through its negative impact on vegetation health and the associated secondary succession. Nevertheless, the bacterial and fungal communities again responded differently. The positive effect of die-off on bacterial richness was largely due to the colonization of the space formerly occupied by dead Juniperus by grasses and herbs, which were richer in plant species. This interpretation is supported by models including vegetation diversity, and by the convergence between bacterial composition under damaged Juniperus woodland and under shrublands and grasslands (see first axis in Fig. 3). This further confirmed other previous observations highlighting the rapid readjustment of soil bacterial communities to changes in vegetation associated with tree mortality (Curiel Yuste et al., 2012; Barba et al., 2013). It also suggested that soil bacterial communities are good indicators of below-ground colonization processes occurring during secondary succession. The increased richness in die-off vegetation was accompanied by lower evenness, particularly in Juniperus woodland, which corresponds to a higher number of dominant and/or rare taxa (Deslippe et al., 2012).
In contrast, the response of fungal communities to the weather-induced die-off resulted in a reduction in richness in defoliated Juniperus woodlands, probably due to the dependence of the mycoflora on the productivity and health of the Juniperus individuals (Högberg, Löfvenius and Nordgren 2009; Williams et al., 2013). Other studies have also shown that fungal soil communities are generally less sensitive to seasonal drought conditions than bacterial ones (Curiel Yuste et al., 2011; Barnard, Osborne and Firestone 2013). Unlike undamaged stands, the positive relationship between SOM and fungal richness in die-off stands suggested that the scarcity of this resource (SOM) in damaged shrublands (Table 1) might have negatively affected at some extent the saprophytic fungal community.
Soil functional properties: respiration and microbial activity
Overall, microbial respiration and microbial metabolic activity were better explained in our models than the indicators of soil microbial diversity and structure. The functional properties of the microbial community were therefore more predictable than the structural properties, as they are more directly linked to physical–chemical variables, such as temperature, water availability and substrate, i.e. SOM decomposition (Curiel Yuste et al., 2007).
In unaffected stands, indicators of microbial metabolic activity (microbial BR, SIR and qCO2) were mainly explained by vegetation type, together with local effects. Grassland displayed higher BR, SIR and qCO2 than woody-dominated vegetation (Table 1), probably because the tissues produced by herbaceous species had lower proportions of lignin and lower C:N or C:P ratios than woody plants (Montane et al., 2010; Zhang et al., 2013), which makes SOM more degradable for microbial consumption. Furthermore, soil samples were collected when herbacous species were at their productive peak, and probably when labile exudate production was at its maximum (Curiel Yuste et al., 2007). Probably as the result of this high metabolic activity of microbial communities, SOM further tended to accumulate less under grassland (Table 1). This higher microbial metabolic activity under grasslands coincided with higher bacterial richness, as explained above. However, the overall statistical relationship between bacterial diversity and microbial functioning was modest, interacting in some cases with vegetation type, and suggesting that in general microbial functioning was somewhat uncoupled from microbial diversity. This was further supported by the fact that fungal richness did not help to explain variability in any of the indicators of microbial functioning, even though other studies have found that fungal biomass is related to SOM decomposition (Curiel Yuste et al., 2011).
Die-off also resulted in changes in the functioning of the microbial communities, as reflected in the increased rates of BR, SIR and qCO2. These results supported previous studies in which drought-induced die-off resulted in higher soil metabolic activity, probably associated with an increase in the labile C pool (Curiel Yuste et al., 2012; Barba et al., 2013). We hypothesize that these effects of die-off on soil functioning could be attributable, at least partially, to the litter increase after defoliation, which remained for several years. The increase in microbial metabolic activity was not associated with an increase in the microbial biomass (MBC) but rather with a shift in the structure and composition of the microbial community. We hypothesize that this shift would involve an increase of pioneer, r strategy-like microorganisms, with high turnover rates, with respect to K strategy-like microorganisms.
Die-off further strengthened the relationship between the structural characteristics of soil microbial communities, particularly bacteria, and their functioning, as reflected in the significant role played by bacteria in predicting variations in soil metabolic activity. This indicated that changes in soil C stocks associated with die-off could be partly caused by the structural and functional adjustments experienced by microbial communities. Therefore, although the contribution of microbial communities in our statistical models remained lower than the effect of die-off itself, this study provided novel evidence of the direct relationship between microbial diversity and soil CO2 fluxes. Thus, any models considering soil C dynamics under strong weather-driven ecological perturbations and subsequent succession should consider the ecology of microbes, particularly bacteria, and their ecological relationships with plants.
CONCLUSIONS
Bacterial and fungal communities showed contrasting patterns in relation to the diversity of vegetation and soil C properties (Zak et al., 2003). There was a gradient of decreasing SOM quality, reflected in lower BR, SIR and qCO2, from grassland to Juniperus woodland, limiting the richness of bacterial communities. This SOM gradient coincided with a decrease in plant diversity that provided niches to the bacterial guild. In contrast, fungal communities increased their relevance in terms of richness in Juniperus woodland, and we attribute this finding to their ability to consume less degradable SOM.
Our study revealed that weather anomalies produced effects on microbial communities that persisted for several years after the weather event, in contrast with the resilience of soil microbial communities observed in experimental climate manipulations (Cruz-Martinez et al., 2009; Curiel Yuste et al., 2014). This delayed effect on microbial soil communities was associated with the remaining impact of vegetation die-off, involving changes in vegetation composition and soil properties, and corresponded with observations from Mediterranean forests that have experienced drought-induced die-off (Curiel Yuste et al., 2012). As regards the bacterial guild, the drought event did indeed act as a typical disturbance, promoting a pulse of diversity by generating new habitats, increasing resource availability or releasing competition. In contrast, in the fungal guild, the effect of the episode was more sensitive to habitat modification, in our case that of the Juniperus woodlands, which was largely determined by the fate of the dominant species.
In conclusion, this study revealed how the impacts of climate change on vegetation spread to soil microbial communities. Thus, weather events have the potential to produce relevant changes in ecosystem functioning by modifying the functional properties of soils through changes in soil microbial communities. Given that current climatic projections point to an increase in episodes of climatic anomalies that could result in vegetation shifts (Lloret et al., 2012), these cascade effects merit further attention. In addition to the expected modification of microhabitats (radiation and consequently temperature and humidity), the mechanisms involved in the climatic modification of the relationship between vegetation and the soil microbial community include changes in litter quantity and quality as well as changes in rhizosphere—and related exudates—, which are determined by standing vegetation.
R. Díaz-Delgado (EBD-CSIC) and personnel from the ICTS-RBD kindly supported this research.
FUNDING
This study was supported by the Spanish Ministry of Education and Sciences (projects CGL2009-08101, CGL2010–16373, CGL2012–32965), by the Ministry of Economy and Competitiveness (CGL2013–42271), by the Government of Catalonia (AGAUR grants 2009-SGR-00247 and 2014-SGR-453), by the ICTS-Reserva Biológica de Doñana (projects 38/2007, 27/2009, and 11/2013) and by the Government of Madrid (REMEDINAL 2; CM S2009 AMB 1783). JCY acknowledges the support of the ‘Ramon y Cajal’ program.
Conflict of interest statement. None declared.
REFERENCES