Abstract
This work addresses the potential impact on water quality and quantifies the benefit of the low carbon power source of floating solar panels in evaporation reduction when using them on an open water body, such as an agricultural irrigation pond in semi-arid regions. By utilizing agricultural ponds for low carbon energy conversion, and saving precious water through evaporation reduction, the highly vulnerable agricultural sector will be empowered. A pilot size setup is prepared, key water quality parameters were monitored and evaporation quantities in a PV-covered pond are compared to those from an adjacent open water pond used as a control. Several inclination angles for the panels were tested. Results showed no adverse impact on the water quality; on the contrary, there is evidence of improvement particularly in nitrate and chlorophyll concentrations. Moreover, a reduction of ~60% in evaporation was observed; power generation from the floating panels, on the other hand, was statistically similar to that from ground-mounted panels.
1. INTRODUCTION
Water-quality parameters of relevance vary depending on the type of use for the water. Requirements for drinking water are more stringent than those for irrigation water for example. For surface water, that is primarily used for irrigation, or for drinking after further treatment, the main parameters of concern involve pH, total suspended solids, total dissolved solids, nutrients (nitrogen and phosphorous compounds) and chlorophyll-a (chl-a). If some or all of the previous parameters cannot be measured, then some surrogate parameters can be measured and these would give a generally good idea of the quality of water, a well-known example of these parameters is the dissolved oxygen [1]. Covering the open water bodies (reservoirs, lakes, irrigation ponds) can have an impact on the quality of the water. This impact has been qualitatively addressed in a few studies [2], [3], [4], [5]. The following paragraphs establish some background information on the different aspects of the study; the last paragraph summarizes the research contribution of this study.
Floating water covers have been historically used for several purposes, one of which is evaporation reduction. These can be modular and flat covers floating on the water surface. By reflecting a proportion of the incoming solar radiation, they act as a physical barrier to the passage of water vapor. These floating covers need to be moored by some anchoring mechanism [6].
Despite their occasional use, floating water covers were usually implemented empirically without comprehensive solid theoretical analysis of their benefit and the optimized conditions of their operation. The study by Aminzadeh et al. [7] addresses the floating element properties, the climate and reservoir conditions to better assess the evaporation losses and heat balance in the open water bodies.
Some studies involve analysis of the theory behind the evaporation reduction and quantification by modeling energy balances for fully and partially covered water bodies. Evaporation reduction percentages were reported as high as 80% in lab experiments [7]. [8] demonstrated the added economic value to using transparent partial covers to solar ponds, and analysis also involved quantification of evaporation suppression. Different materials have been used for coverage of water bodies ranging from modular plastic disks to spheres to palm fronds [9, 10]. Several published studies and reports address the different technologies used to cover water bodies [6–16].
Among the many options for covering open surface water bodies are floating photovoltaic (PV) panels. These have been gaining attention lately due to their numerous advantages, including reducing evaporation, conserving precious land, especially in agricultural settings, and potentially better energy yield due to fewer obstacles to sunlight and lower panel temperature. Some additional water quality improvements are also mentioned [5], [4], [17].
PVs are particularly desirable as one of the technologies most suitable to minimize greenhouse gas emission and mitigate global warming [4]. Researchers have identified five types of installations for PVs, ground mounted, canal top, roof top, offshore and floating, each type has its own advantages and disadvantages [5]. The floating system consists of several components; a floating system that is buoyant and allows the installation of the PV module, a mooring system to anchor the floaters and maintain their orientation, some underwater cables and the PV system consisting of the panels, controllers, inverter and a distribution line. [4]. The floaters come in all shapes and sizes and many of their designs are patented [18], [4].
Operational conditions for ground installations are different from floating PV installations as reported by [17]. This clearly has an impact on the performance of the system and its overall efficiency. For example, ambient air temperature have been reported to be less by 1–3°C above the water body than it is on ground installations. Wind speed has been observed to be higher in open water bodies and thus could potentially reduce the panels’ temperature and increase their efficiency.
Floating PV technology and applications are fast developing. Several large and medium size projects are operational already and are producing MW-scale electrical generation [19]. Several studies address the introduction of the floating PV panels to supplement other power generation technologies, such as hydropower [2], and some investigate their use as a solar heating system [20].
A study by [21] argues that the floating solar panels are very efficient power source that could be sufficient to secure the needs of the United States. According to their research, that is achievable if 128 of the hydroelectric power generating lakes are equipped with floating PV systems. The study was based on a 24% module efficiency, which is the current state of the technology. It is argued that this efficiency level is even conservative relative to the fast pace of development. Another study on the state of Ceara in Brazil concluded that as high as 18.8% of the electrical needs of the state of 8.8 million inhabitants can be met by installation of cooled floating solar panels, which were also found to yield 12.5% more than their ground-mounted counterparts [22]. The floating PV applications are attracting the attention of countries all over the world, from Bangladesh to Australia to South Africa [23–26].
Some of the drawbacks that are typically discussed with respect to floating PV technology are associated with aesthetic considerations, reduction of accessibility and recreational availability of the lakes and water bodies and some concerns on water-quality issues that may have a negative impact on the ecosystem [6]. Reported that once sunlight is blocked, damage to primary producers is likely to occur. They also anticipated that the reduction of the oxygen transfer due to the presence of coverage at the lake surface would result in lower overall water quality. Another drawback is related to the discontinuity of the power generation due to fluctuation of sun radiation as outlined by [21]. Their proposed solution to that is oversizing the PV and then dynamically curtailing the output. While counter intuitive, this approach is claimed to reduce the overall cost of the system of PV and storage despite the extra cost of the oversized PVs. One of the existing concerns of the investment in floating PV systems is the lack of long enough experience to properly assess the degradation of the system, this technology is rather young and there is not enough data to identify long-term effects [17].
Regions of semi-arid to arid environments experience high evaporation rates, thus the need for minimizing evaporation rates while maintaining proper water quality. Many of these regions also experience high solar radiation values; an example is the Jordan valley, close to where this study was conducted. The reported solar radiation in the Jordan valley ranges between 5000 to 5600 Wh/m2/day [27]. These attractive rates of solar radiation make the installation of the low carbon floating solar panels even more appealing.
Limited studies quantitatively addressed the water quality impact by the shielding effect of the floating solar panels. Similarly, evaporation reduction has been qualitatively addressed in some studies but very few quantify it particularly in semi-arid regions, where its impact is expected to be higher. These two aspects are important especially in inland fresh water resources, where water is more prone to water quality deterioration due to its low salinity, and where water is scarce and thus expensive. This research fills that gap by systematically and quantitatively investigating the quality of fresh water as it is covered by the floating solar panels, and by investigating the reduction of evaporation rates due to the shading effect and quantifying its value. This work provides an intermediate step, in which a pilot size setup was used. The next steps would involve testing the effect of the floating solar panels on a full scale agricultural irrigation pond.
2. MATERIALS AND METHODS OF ANALYSIS
Where:
E: Evaporation (cm), ρ: Density, Le: Latent heat of vaporization (J/kg), T: Temperature °C, |$\boldsymbol{\Delta }$|: the slope of the es Vs T curve (mb/oC), |$\boldsymbol{\gamma}$|: Psychometric Constant (mb/oC), QN: net radiation absorbed (Energy/area-time), Ea has units of energy flux (Energy/area-time), a,b: empirical constants, u: Wind speed (m/s), esa: Saturation vapor pressure at temperature of the air (mb), ea: Actual vapor pressure in air = Relative humidity X esa.(mb).
As it can be seen, the Penman equation has the advantage of being physically based and that the water and soil surface temperature need not be known. It has the disadvantage, though, of requiring net radiation absorbed and the vapor pressure deficit. These parameters, while measurable, require expensive instruments not readily available in common weather stations.
Several attempts were made to simplify evaporation assessment using readily available weather data. The work by John D. Valiantzas [30] is a perfect example of a developed simplified formula for the Penman evaporation equation using routine weather data. In this developed method, only data on air temperature, solar radiation, relative humidity and wind velocity need to be measured. The rest of the needed parameters are site specific and are easily obtainable. This method was tested and verified to provide very accurate resemblance to the standard Penman method [30].
Where:
α is reflection coefficient of Albedo (0.08 for open water surfaces), Rs is solar radiation (Mj/m2.d), RA is extraterrestrial solar radiation (Mj/m2.d), T is temperature (°C), RH is relative humidity (%), au = Penman coefficient = 1 when using the original Penman equation, u is the wind velocity (m).
Given that very few studies address that evaporation process in a floating PV system, this study utilizes a pilot scale test to quantify evaporation and monitor water quality. Figure 1 shows the system that was prepared to study the impact of the floating solar panel on the water quality and to evaluate the evaporation reduction potential. The pilot experiment was set at the German Jordanian University premises in Amman, Jordan.
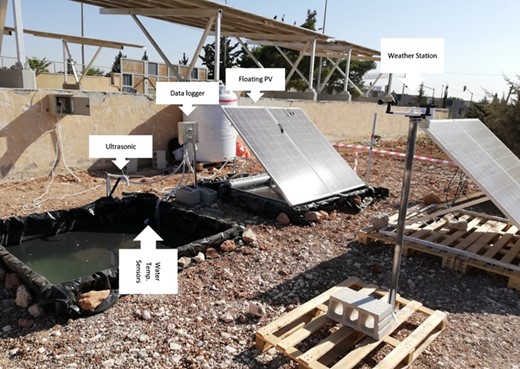
Pilot test setup with two tanks; control and covered with the floating PV panels.

Two tanks (2 m × 2 m × 1 m each) were fabricated from 2-mm galvanized steel. Once placed in the ground, they were lined with black plastic polyethylene sheets similar to those used to line agricultural earth ponds. The two tanks protruded ~20 cm above the ground surface. During the experiments, one of the two tanks was kept exposed (control) while the other was covered with the floating PV structure.
Two floating PV panels were used (2 m × 1 m each). One of the panels was monocrystalline with a power rating of 365 W, while the other was polycrystalline with a power rating of 325 W; the choice of the two different types was to compare their energy yield performance. These panels were mounted on an aluminum structure that was designed to allow for different angles of inclination. The aluminum structure was fixed on floaters made of 10-inch PVC pipes connected in full square shape with 196 cm side. Design calculations suggested that this pipe size pipe will be able to carry the dead load of the aluminum and the floating PVs while still floating. An identical structure of two panels was ground mounted; this was used to do a comparison of the performance of the two systems (floating and ground mounted).
Water was supplied for two experiments from two different sources; the first was a ground water source in Jordan (Hesban Wells, Madaba), this was tested for ~6 weeks, the other was a surface water source (Mujeb dam), for which the majority of measurements were made. Water quality was monitored for the two tanks to assess the impact of the water coverage via the solar panels on the quality of water. Water sampling was done by grab samples collected on a weekly basis and analyzed in a certified lab for the parameters of ortho-phosphate (using the method Stannous Chloride SM:4500-PD), nitrate as NO3 (using the method ion chromotographic SM 4110 B) and chl-a (using the method flurometric determination). These parameters are among the most important indicators of surface water quality, nitrogen and phosphorous are important nutrients known to cause algae growth, a very common water quality concern in open water bodies. Chlorophyll-a is also an indicator of the eutrophication state of the water body. Water temperature at various depths was also monitored at each of the two ponds. The two sources of water described earlier were chosen to evaluate the impact of the initial water characteristics on the water quality changes due to the placement of the floating PV panels. Samples from the first water source were analyzed weekly between 19 August 2018 and 24 September 2018, while those from the second source were analyzed weekly between 30 September 2018 and 6 November 2018. Samples were collected according to proper sampling procedure and were analyzed at the labs of the Water Authority of Jordan.
An Ambient Weather® weather station (model WS2902) was installed onsite to accurately and continuously record the meteorological data during the measurement process. Water elevation was automatically monitored by a system of measurement and data logging. The system consisted of a locally developed data logger and two ultrasonic sensors to measure depth to water, in addition to a set of six submerged water temperature sensors, three in each tank, to measure the water temperature at various depths, further details on the data logging system can be found at [31]. This monitoring system had an additional ambient air temperature and humidity sensor. Figure 2 shows the different electronic components/sensors that were used in home developed data collection system and data logger. The developed data collection system was composed of ultrasonic sensors for accurate and continuous distance measurements and temperature sensors to measure the water temperature at different depts.
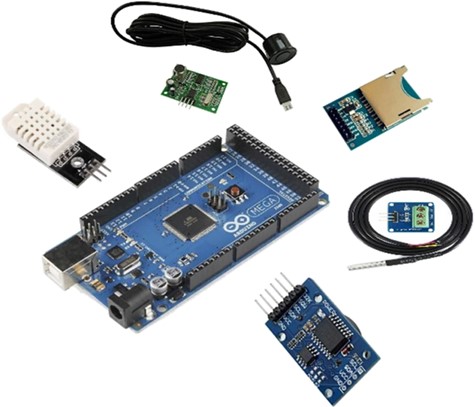
Components used for distance and temperature measurement and data logger.

Evaporation monitoring involved daily measurement of the water level. That was done manually and automatically and the results of the two were compared. Manual measurements were done by measuring the depth to water from the edge of the tank while the automatic measurements spanned longer (~9 months total) and were done using the locally developed ultrasonic monitoring system.
Different inclination angles for the solar panel were investigated. The lowest angle was zero degrees resembling a flat panel laying horizontally over the water and providing full coverage, the next angle was 27 degrees (within the optimal range of this region) and the third one was 42 degrees. The choice of the angles was also governed by the capacity of the holding aluminum structure. During this investigation, the structure was set at each angle for a week and the cumulative evaporation and average ambient temperatures were reported.
Majority of the tests results are displayed by showing a comparison between the performance of the control pond and the PV-covered pond. Time series graphs of the results of the two setups were created, and standard statistical tests were made when necessary (t-test, F-test, etc.).
Theoretical evaluation of the evaporation was done using the simplified version of the Penman method (equations 7 and 8 shown earlier). The most needed input parameters were meteorological data that were obtained from the on-site weather station. Theoretical evaluation of evaporation was done, and the results were compared to observed evaporation values.
3. RESULTS AND DISCUSSION
The energy yield of each of four panels was recorded at different loads. Experimental outcomes indicate a slight advantage of the floating system power generation over the land mounted one; that advantage cannot be statistically verified given the collected data. Figure 3 shows the IV curve for the four panels. It is observed that the monocrystalline panels outperform the polycrystalline ones, which is expected given the power rating of each (365 W for the mono Vs. 325 W for the poly). The floating monocrystalline panel generally produced the highest current relative to the others, the floating polycrystalline one did not follow the same trend; the land-mounted panel outperformed it. These variations are too small to be statistically significant and may be attributed to the individual panels yield characteristics.
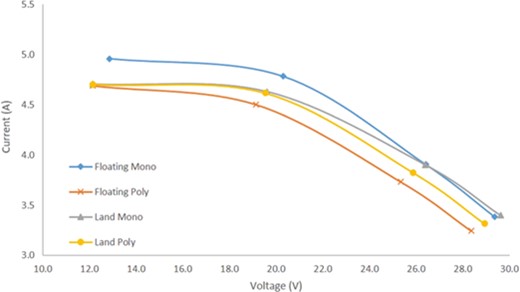
I-V curves for the four panels.

Water quality analysis for the two water ponds from two different sources was done. One of the most visible symptoms of surface water pollution is eutrophication, which results from excessive presence of nutrients. An important indicator of eutrophication potential is chl-a, in addition to basic nutrients, such as nitrate and ortho-phosphate. Results of this study show no deterioration in the water quality due to the presence of the floating PV panels. In fact, there is evidence of improved performance of the PV-covered pond relative to the control one, especially for chl-a test of the Husban ground water in the control pond, where an increase in the concentration of chl-a from below detection up to ~22 μg/l. Water in the PV-covered system did not show noticeable increase in the concentration. Mujeb surface water source on the other hand showed a systematic reduction of the concentration of chl-a for both floating and control systems. Reduction in chl-a concentration is attributed to the blockage of the direct sun by the floating panels, where sunshine is important for algae growth, a major contributor to chl-a. Nitrate concentrations where higher in the water from Husban wells compared to that from Mujeb dam. The control system showed a slight increase with time relative the PV-covered one in the water from Husban wells concentration (yet not statistically verifiable). The higher concentration of nitrate in the ground water could potentially be attributed to contamination due to agricultural activities, since most of the area surrounding the well is agricultural, it may be also attributed to leaking septic tanks. Ortho-phosphate concentrations are mostly below the detection limit of 0.06 mg/l. Such values are reported at 0.06 mg/l. Figures 4–6 show the results of the water quality testing. As a conclusion, it can be observed that the PV coverage of the water body did not have a degrading effect on the water quality; on the contrary, it may be credited with limiting chl-a and nitrate concentrations.
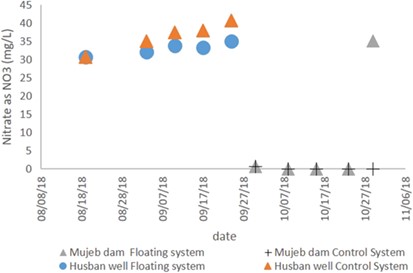
Nitrate as NO3 concentration for the control and PV-covered systems from two water sources.

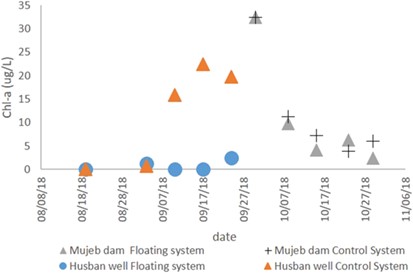
Chlorophyll-a concentration for the control and PV-covered systems from two water sources.

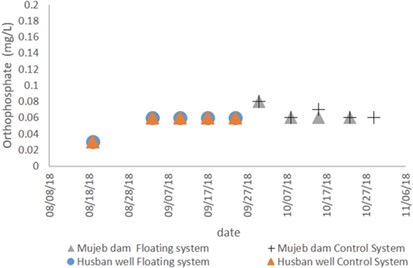
Orthophosphate concentration for the control and PV-covered systems from two water sources.

Evaporation monitoring tests were conducted over a duration of ~9 months at a panel inclination angle of 27 degrees, a full range of temperatures were experienced throughout. Figure 7 shows the maximum daily ambient temperature (left). Temperature range throughout the year was between 10°C and 40°C, which is typical in the experiment region.
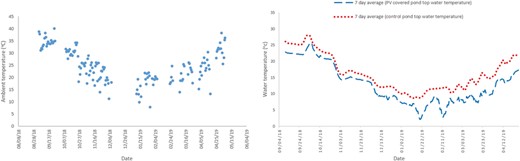
Max daily air temperature (left) and water top temperature for control and PV-covered pond (right).

As expected, shading with the floating PV panels resulted in a reduced overall temperature of the water as shown in Figure 7 (right). Statistical analysis of the top temperature (surface temperature) data indicated a significant proof at 5% confidence level (t-statistic = 6.5 relative to 1 tail t-critical = 1.6) that the control pond was warmer than the PV-covered pond. This is rational given the more exposure to solar radiation in the exposed control pond.
The temperature variations with depth were analyzed for both the PV-covered pond and the control pond. The PV-covered pond showed no statistical difference at 5% confidence level between the bottom and top temperature, while the control pond, exposed to direct sunlight, showed a statistically significant difference between the bottom and top temperatures when tested using the t-test for analysis of means, assuming un-equal variances (which was also verified for the data). The t-statistic was 1.83, while the one-tail t-critical was 1.65. The higher value for t-statistic indicates rejection of the null hypothesis of equal means. It is expected that higher water temperatures will yield higher evaporation rates. This is to be verified by analysis of the test results.
Field tests demonstrated that the evaporation rates from the control pond are significantly higher (at 5% confidence level) than those from the PV-covered ones. Figure 8 shows the time series of the evaporation rates (mm) from the control pond and from the PV-covered pond after being corrected to account for the reduced exposed surface area in the floating PV pond due to the floating structure. Gaps in the figure are due to the monitoring system failure for certain times mainly during extreme winter weather.
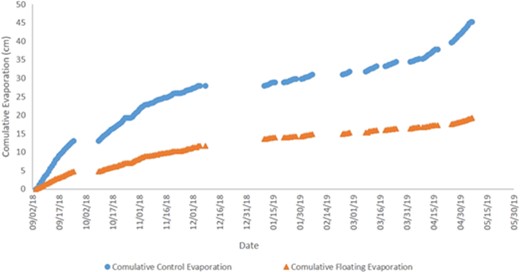
Cumulative evaporation for the control pond and the PV-covered pond.

To quantitatively assess the increase in evaporation percentage in the exposed control pond relative to the PV-covered pond a histogram was generated. As can be seen in Figure 9, ~80% of the reported evaporation increase was between 100% and 300%, which is another clear indication that the coverage of the ponds with the floating solar panels reduced the rate of evaporation. The overall average daily evaporation from the control pond was ~1.84 mm/day while that of the PV-covered pond was 0.76 mm/day, a reduction of the evaporation rate of 59%. Rates of evaporation obviously change with season and ambient weather conditions. Higher rates of evaporation were reported in a study by [7]. They reported a reduction of 80% in lab setting using flat coverage. The results reported before in our experiments were using a panel angle of 27-degree with the water surface. This angle allowed for some indirect sunlight and wind to reach the water surface, hence the potentially higher evaporation.
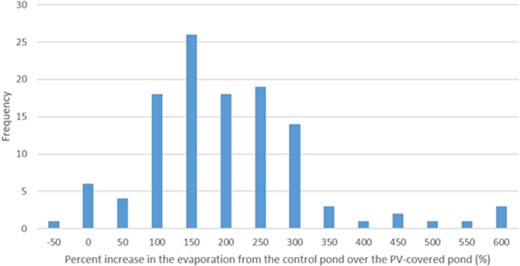
Histogram of evaporation increase percentage.

Increased evaporation rates have positive correlation with higher temperatures and inverse proportionality to higher humidity. Table 1 lists the correlation formulas between the evaporation in the two ponds as a function of both temperature and humidity along with the calculated coefficient of determination. The relations show good correlation between the average evaporation and the 7-day average temperature with a coefficient of determination ranging between 0.6 and 0.8, while the correlation was not as good for the humidity (0.3–0.5). This is attributed the high fluctuations in humidity with time of the day, unlike the temperature where the values are more consistent.
Correlation equations between evaporation and temperature and humidity for both the control pond and the PV-covered pond.
| Pond | 7-day average temperature | 7-day average humidity |
|---|---|---|
| Control | Evap. (cm) = 0.0258 Temp (°C)—0.3527 | Evap. (cm) = −0.0078 Humidity (%) + 0.7916 |
| R 2 = 0.8 | R 2 = 0.5 | |
| PV-covered | Evap. (cm) = 0.0073 Temp (°C)—0.0732 | Evap. (cm) = −0.0018 Humidity (%) + 0.2276 |
| R 2 = 0.6 | R 2 = 0.3 |
Inclination angle analysis shows a visible trend of reduced evaporation the lower the PV-panel angle is; this observation is rational due to the more limited exposure to the sun with a lower inclination angle. This conclusion, however, cannot be statistically verified as there are no sufficient data points to merit a statistical evaluation. Another point to consider here is the energy yield of the different inclinations; this has not been fully studied for the purpose of this work and will be done in future studies. A tradeoff must be made between the advantage of reduced evaporation and the potential loss of energy yield the flatter the panel is. Figure 10 shows the effect of the inclination angle on the reported average daily evaporation, keep in mind that inclination angle analysis was done such that each setup was tested for a week. The results shown here are different that those reported earlier of the whole 9 month test in which the inclination angle was fixed at 27 degrees throughout the whole duration.
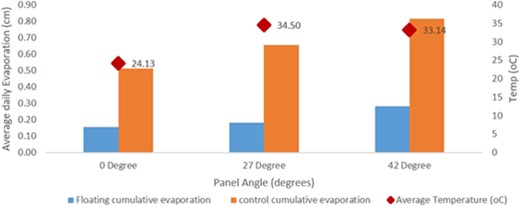
Angle effect on evaporation.

Theoretical evaluation of the evaporation rate was made possible thanks to the abundance of the meteorological data available at the site. Equations 7 and 8 presented earlier were used to evaluate evaporation from temperature, wind speed, solar radiation and relative humidity, all parameters are measured using the on-site weather station. A good match was achieved between the observed and predicted daily evaporation values. Figure 11 shows the observed evaporation rates plotted against the measured evaporation rates with a 45 degree line. Data points are distributed around the 45 degrees, indicating a good match between the observed and predicted values. Developing the model for theoretical calculation of evaporation is critical for future feasibility analysis studies of floating solar panels. The model was successful in satisfactorily evaluating the evaporation quantities and therefore can be utilized in evaluating the added value due to power conversion and evaporation reduction for any project in a semi-arid area under similar conditions.
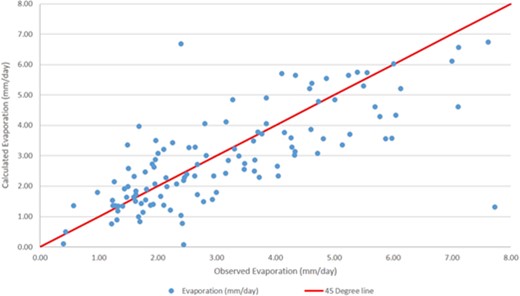
Observed and measured evaporation plotted against each other with a 45-degree line.

4. CONCLUSIONS
Floating solar panels demonstrated higher power yield during the majority of time; power produced by floating panels was higher than that produced by land mounted 55% of the time (on average) when measured under the same conditions. Water quality underneath the panels showed an improvement, especially for chl-a concentrations, where limited exposure to direct sunlight tend to inhibit algae growth, for the groundwater source, the average reduction of the concentration of Chl-a in the covered system was 61%, the reduction in the surface water source was averaged at 17.5%. Nitrate concentrations decreased slightly in the floating system (up to 14% in the covered system), while the orthophosphate did not show any noticeable change. In general, the water quality results are in favor of using the floating solar panels.
An extensive 9-month experimenting demonstrated the added value of using floating solar panels in reducing evaporation from open water bodies in studied semi-arid region. An average reduction of evaporation of 60% was demonstrated over the whole duration, with ratios greater than that for specific time periods. The angle of inclination had an impact on the rate of evaporation; generally, the flatter the panel is, the less the observed evaporation was, this is due to the reduction of water exposure to solar radiation; this conclusion could not be statistically verified though.
The results of this study pave the way for a full size application, in which agricultural irrigation ponds can be covered with floating PV systems and the performance in terms of power yield, evaporation reduction and water quality can be monitored.
Acknowledgment
The author would like to acknowledge the deanship of Graduate Studies and Scientific Research at the German Jordanian University for providing funding for the project. The author would also like to acknowledge engineers Tameem Haddadin, Mothafer Al-Jaáfreh, Khaldoun Ayoub and Ahmad Al Hmoud for their help with various elements of the project.