 https://orcid.org/0000-0003-0229-7007
Abstract
This study examines the impact of shared decision-making on investor overconfidence. Data from 2,000 investors, 6,394 consumers, and 657 experimental participants shed light on whether consumers who engage in joint financial decision-making are less affected by investor overconfidence than those who decide on their own. The findings show that investors who jointly decide are substantially less overconfident. However, family- or friend-inclined interactions are more effective in reducing overconfidence than relying on a financial advisor. The current research theoretically argues and empirically shows that shared metaknowledge drives this diminishing effect by highlighting unknown aspects of a financial decision. Compared to providing investors with solutions, problem reformulation, validation, or legitimation, only metaknowledge consistently decreases overconfidence in joint financial decision-making. It is argued that the process of highlighting unknowns can explain why interactions with family and friends have a more pronounced impact on investor overconfidence than consulting a professional advisor. The study provides a feasible debiasing tool to consumers, financial institutions, and other financial service providers to decrease overconfidence by emphasizing unknown aspects of an investment toward improving the quality of a consumer’s financial decisions under uncertainty.
In January 2021, retail investors created a short squeeze that forced institutional investors to close their position in the video retailer GameStop and other businesses with perceived pop culture status, such as the movie theater chain AMC (Umar, Yousaf, and Zaremba 2021). The stock-buying frenzy that led to market distortion was seemingly coordinated on Reddit. Publicly dubbed as a battle between private investors and Wall Street, predatory trading was largely driven by a group of retail investors with a history of gambling-like trading behavior. This includes initially shorting (essentially betting on falling prices) GameStop stocks prior to taking a long position (Hasso et al. 2021). Research suggests that such high-risk, high-frequency trading behavior is a manifestation of investor overconfidence (Daniel, Hirshleifervid, and Subrahmanyam 2002; Daniel and Hirshleifer 2015; Merkle 2017). However, the impact of coordinated or joint financial decision-making, as seen in the GameStop short squeeze example, on overconfidence is largely unknown. For instance, does joint decision-making increase or decrease investor overconfidence and does the effect depend on whether decision-makers are professionally or personally linked?
This gap in the consumer behavior literature is troubling because an array of empirical studies has suggested that being overconfident is a suboptimal characteristic on the financial market (Daniel and Hirshleifer 2015; Malmendier and Tate 2015; Merkle 2017). Overconfidence is defined as an overestimation of a person’s capabilities and an underestimation of the role of risk and ambiguity (Lichtenstein, Fischhoff, and Phillips 1977). Overconfident investors predict the outcomes of future endeavors to be more positive than they will be and overestimate the precision of the underlying information (Odean 2002). This tendency hurts a consumer’s portfolio and decreases long-term returns (Merkle 2017). Overconfident investors stand in contrast to calibrated consumers who can accurately assess their skills and knowledge. As most financial decisions are not made in isolation, knowing if and how joint decision-making impacts investor overconfidence is important in improving the quality of consumers’ financial decision-making (Ward and Lynch 2019).
Generally, little attention has been paid to the impact of joint decision-making on overconfidence in a financial context. For instance, the fact that the primary investment account holder can be identified does not imply that investors make their decisions isolated from others (Liu, Dallas, and Fitzsimons 2019). Partners, family members, friends, or brokers can be involved in the chain of events that leads to a decision. The call to hold, sell, or buy is an observable outcome, but overconfidence affects the decision-making process itself. While consumer researchers have pointed out that individual choice is rare, the impact of joint decision-making on distorted consumer financial choice remains critically understudied (Bagozzi 2012; Simpson, Griskevicius, and Rothman 2012). This study attempts to fill the gap in the literature by shedding light on the connection between joint decision-making and overconfidence in four studies.
Nationally representative secondary data from 2,000 investors and approximately 6,400 consumers are analyzed to examine whether joint decision-makers exhibit lower levels of overconfidence compared to those who decide on their own. In addition, two experimental cooperation tasks were designed and distributed among 657 investors. Preregistered primary data support the causal claim that shared decision-making reduces overconfidence. The experiments also test alternative explanations and show that metaknowledge drives the reduction in overconfidence. Specifically, making unknown aspects of a financial decision more salient during deliberations outperforms other aspects of joint financial decision-making. The outcomes can explain why not all types of sharing are equally effective in calibrating a person’s overconfidence level. Working with family members and friends appears to be more effective in reducing investor overconfidence than relying solely on financial advisors. Professional services focus on objective knowledge and are, therefore, not well positioned to share metaknowledge.
The contributions of this research are threefold. First, the understudied impact of joint financial decisions on investment knowledge and confidence is assessed. Joint financial decision-making seems to significantly impact confidence in one’s financial knowledge but not objective knowledge, thereby underlining the notion that joint financial decision-making is not primarily a knowledge-generating process. Second, the moderating effect of different relational ties on overconfidence is revealed. Joint financial decision-making with family and friends appears to have a more calibrating effect than professional financial advice. Third, the mediating role of making unknowns more salient is discussed. Highlighting unknown aspects of a financial decision drives the calibrating effect on confidence. The combination of these three contributions has important implications for the financial service sector and the distribution of consumer financial well-being. Highlighting unknown aspects during joint financial decision-making can serve as a powerful debiasing tool. The following section discusses the relevant literature and the theoretical framework of this study.
THE INTERPLAY BETWEEN JOINT DECISION-MAKING AND INVESTOR OVERCONFIDENCE
From a decision-maker’s standpoint, working with others can have five distinct benefits: solutions, metaknowledge (i.e., knowledge about one’s knowledge and the limits thereof), problem reformulation, validation, and legitimation (Cross, Borgatti, and Parker 2001; Heath and Gonzalez 1995). These five benefits, also called dimensions, capture the essence of joint or interactive decision-making. Consequently, the current study follows the multi-dimensional definition of interactive decision-making formulated by Heath and Gonzalez (1995) and Cross et al. (2001). Henceforth, joint financial decision-making is operationalized as any process in which an investor seeks solutions, metaknowledge, problem reformulation, validation, or legitimation from others for the purpose of making a financial decision. Based on Bonaccio and Dalal (2006, 143–46), the industry terms “financial advice,” interactive financial decision-making, and joint financial decision-making are used interchangeably.
Joint Financial Decision-Making
Personal Financial Advice
Early consumer research highlights the importance of interactive decision-making, especially within households (Davis 1976). This is underlined by findings suggesting that source similarity plays a critical role in the decision-making process (Faraji-Rad, Samuelsen, and Warlop 2015). For instance, family members or friends have a greater likelihood of sharing common characteristics with the decision-maker than, say, a professional financial advisor, and their decision inputs are, therefore, more persuasive (Park and Sela 2018, 309–12). Source similarity can also be used as a means of validation (Mojzisch et al. 2008; Wanzel, Schultze, and Schulz-Hardt 2017). For example, investors can involve family members or friends (i.e., close relational ties) to validate their financial decisions by relying on common characteristics (e.g., risk aversion and trading style) that may increase the chances of emotionally supporting a financial decision.
In addition, nonprofessional interactive decision-making has been shown to increase rationality by changing the perspective of a problem (Schotter 2003). This is in line with the notion of problem reformulation. Furthermore, Ward and Lynch (2019) show that couples exhibit an increase in the specialization of labor over time. In other words, joint financial decision-making seems to decrease among married couples over time as one partner disengages from those responsibilities and is only involved whenever strictly necessary. This suggests a certain degree of reliance on others within close ties to come up with solutions to financial decisions that need to be made. Furthermore, research implies that nonprofessional financial advice may increase an investor’s metaknowledge (Cwynar et al. 2020). For instance, if friends or family members mention that they do not know the answer to a financial question, it will have a calibrating effect on investors’ confidence in their own financial knowledge. This is significant because gaining metaknowledge through financial advice reiterates that interactive financial decision-making is not primarily a knowledge-generating process (Bonaccio and Dalal 2006; Britt et al. 2015; Heath and Gonzalez 1995). Finally, while four of the five benefits of joint financial decision-making within close relational ties have received scientific attention, personal financial advice does not seem to provide an acknowledgeable degree of legitimation. This is because, by nature, nonprofessional advice lacks the formality and credibility of professional financial advice (Zaleskiewicz et al. 2016).
Professional Financial Advice
Compared to personal financial advice, professional financial advice is a marketable service. If there are no sufficiently appealing options available for financial advice from individuals within close ties, an investor may seek help from a professional financial advisor or other financial experts. Prior consumer finance research has pointed out that the primary reason for seeking professional financial advice is to generate solutions (Finke, Huston, and Winchester 2011, 19). In fact, consumers attribute higher levels of competency to financial advisors who recommend action rather than inaction (Zaleskiewicz et al. 2016). Similarly, consumers ascribe greater authority (Zaleskiewicz and Gasiorowska 2021) and perceived competency (Zaleskiewicz et al. 2016) to financial advisors whose recommendations align with their own standpoints. This implies that professional input is also sought for legitimation and validation. In addition, there is evidence that financial advisors may help to make alternative investments or problem-solving approaches (i.e., problem reformulation) more salient (Greve, Frambach, and Verhallen 1995).
Importantly, however, there is little evidence that professional financial advice increases a customer’s metaknowledge. On the contrary, prior research suggests that professional counselors fail to financially debias their clients (Mullainathan, Noeth, and Schoar 2012). This is unsurprising, given that the primary reason for seeking financial advice is to solve specific problems (e.g., retirement allocation and college fund savings). While solutions can debias a portfolio (although Mullainathan and colleagues show that debiasing only occurs if it is in the advisor’s best interest), they cannot debias the decision-making process. However, it is the process that is altered by biased inferences. This aspect illustrates a notable gap in the literature because the question of whether and how joint financial decision-making influences investor overconfidence remains. The next subsection reviews the literature on the “mother of all biases” in consumer finance to subsequently connect the multidimensional aspects of joint decision-making with investor overconfidence.
Overconfidence in Financial Decision-Making
Overconfidence is a cognitive bias that manifests as an overestimation of a person’s capabilities and an underestimation of the role of risk and ambiguity (Lichtenstein et al. 1977). Table 1 summarizes a set of representative studies on investor overconfidence in finance and consumer research. As illustrated, consumer research commonly measures overconfidence as the excess between subjective and objective knowledge, either explicitly (Bhandari and Deaves 2006; but also Walters et al. 2017; de Zwaan et al. 2017) or implicitly (Hadar, Sood, and Fox 2013; Xiao et al. 2014). The current study will enhance this approach by addressing the methodological and theoretical shortcomings. It will also shed light on the underestimation of risk and ambiguity among overconfident investors through observable downstream financial decisions.
PRIOR LITERATURE ON INVESTOR OVERCONFIDENCE
| Authors (year) | Sample | Overconfidence measure | Key findings |
|---|---|---|---|
| Merkle (2017) | UK retail investors | In accordance with Moore and Healy (2008), 90% confidence interval production task for UK stock market return (overprecision), rating their financial skills compared to an undisclosed average (overplacement), difference between expected and actual portfolio return (overestimation) | Investor overconfidence increases trading, risk-taking, and a tendency to hold less diversified portfolios |
| Daniel and Hirshleifer (2015) | Various secondary data | Investor overconfidence was modeled (not measured) | Investor overconfidence can explain observable anomalies, such as excessive trading, short-term momentum, and long-term reversal |
| Xiao et al. (2014) | Time-series student sample | Subjective knowledge measured on 5-point Likert scale; objective knowledge measured by sum of correct responses to eight finance quiz questions | When controlling for objective financial knowledge, higher subjective financial knowledge significantly decreases the likelihood of paying credit card bills and other bills on time |
| Hadar, Sood and Fox (2013) | Students and Amazon Mechanical Turk (MTurk) | Subjective financial knowledge measured on 7-point Likert scale; objective financial knowledge was not measured | Providing technical information or highlighting missing details reduces subjective financial knowledge |
| Bhandari and Deaves (2006) | Canadian pension plan members | Difference between relative confidence in one’s answer and relative accuracy on two finance quiz questions | Older and more educated pension plan members are more overconfidence, and women and self-investors are less overconfident |
| Authors (year) | Sample | Overconfidence measure | Key findings |
|---|---|---|---|
| Merkle (2017) | UK retail investors | In accordance with Moore and Healy (2008), 90% confidence interval production task for UK stock market return (overprecision), rating their financial skills compared to an undisclosed average (overplacement), difference between expected and actual portfolio return (overestimation) | Investor overconfidence increases trading, risk-taking, and a tendency to hold less diversified portfolios |
| Daniel and Hirshleifer (2015) | Various secondary data | Investor overconfidence was modeled (not measured) | Investor overconfidence can explain observable anomalies, such as excessive trading, short-term momentum, and long-term reversal |
| Xiao et al. (2014) | Time-series student sample | Subjective knowledge measured on 5-point Likert scale; objective knowledge measured by sum of correct responses to eight finance quiz questions | When controlling for objective financial knowledge, higher subjective financial knowledge significantly decreases the likelihood of paying credit card bills and other bills on time |
| Hadar, Sood and Fox (2013) | Students and Amazon Mechanical Turk (MTurk) | Subjective financial knowledge measured on 7-point Likert scale; objective financial knowledge was not measured | Providing technical information or highlighting missing details reduces subjective financial knowledge |
| Bhandari and Deaves (2006) | Canadian pension plan members | Difference between relative confidence in one’s answer and relative accuracy on two finance quiz questions | Older and more educated pension plan members are more overconfidence, and women and self-investors are less overconfident |
PRIOR LITERATURE ON INVESTOR OVERCONFIDENCE
| Authors (year) | Sample | Overconfidence measure | Key findings |
|---|---|---|---|
| Merkle (2017) | UK retail investors | In accordance with Moore and Healy (2008), 90% confidence interval production task for UK stock market return (overprecision), rating their financial skills compared to an undisclosed average (overplacement), difference between expected and actual portfolio return (overestimation) | Investor overconfidence increases trading, risk-taking, and a tendency to hold less diversified portfolios |
| Daniel and Hirshleifer (2015) | Various secondary data | Investor overconfidence was modeled (not measured) | Investor overconfidence can explain observable anomalies, such as excessive trading, short-term momentum, and long-term reversal |
| Xiao et al. (2014) | Time-series student sample | Subjective knowledge measured on 5-point Likert scale; objective knowledge measured by sum of correct responses to eight finance quiz questions | When controlling for objective financial knowledge, higher subjective financial knowledge significantly decreases the likelihood of paying credit card bills and other bills on time |
| Hadar, Sood and Fox (2013) | Students and Amazon Mechanical Turk (MTurk) | Subjective financial knowledge measured on 7-point Likert scale; objective financial knowledge was not measured | Providing technical information or highlighting missing details reduces subjective financial knowledge |
| Bhandari and Deaves (2006) | Canadian pension plan members | Difference between relative confidence in one’s answer and relative accuracy on two finance quiz questions | Older and more educated pension plan members are more overconfidence, and women and self-investors are less overconfident |
| Authors (year) | Sample | Overconfidence measure | Key findings |
|---|---|---|---|
| Merkle (2017) | UK retail investors | In accordance with Moore and Healy (2008), 90% confidence interval production task for UK stock market return (overprecision), rating their financial skills compared to an undisclosed average (overplacement), difference between expected and actual portfolio return (overestimation) | Investor overconfidence increases trading, risk-taking, and a tendency to hold less diversified portfolios |
| Daniel and Hirshleifer (2015) | Various secondary data | Investor overconfidence was modeled (not measured) | Investor overconfidence can explain observable anomalies, such as excessive trading, short-term momentum, and long-term reversal |
| Xiao et al. (2014) | Time-series student sample | Subjective knowledge measured on 5-point Likert scale; objective knowledge measured by sum of correct responses to eight finance quiz questions | When controlling for objective financial knowledge, higher subjective financial knowledge significantly decreases the likelihood of paying credit card bills and other bills on time |
| Hadar, Sood and Fox (2013) | Students and Amazon Mechanical Turk (MTurk) | Subjective financial knowledge measured on 7-point Likert scale; objective financial knowledge was not measured | Providing technical information or highlighting missing details reduces subjective financial knowledge |
| Bhandari and Deaves (2006) | Canadian pension plan members | Difference between relative confidence in one’s answer and relative accuracy on two finance quiz questions | Older and more educated pension plan members are more overconfidence, and women and self-investors are less overconfident |
Generally, overconfident investors predict the outcomes of future endeavors to be more positive than they will be and overestimate the precision of the underlying information (Odean 2002). While most psychological studies agree with the notion of a potentially harmful bias (Blanchard, Jackson, and Kleitman 2020; Goodie 2005; Moore and Healy 2008), some studies indicate that overconfident individuals are more persuasive and are attributed to greater perceived competence and commitment in a group setting (Sah, Moore, and MacCoun 2013; Vullioud et al. 2017). However, the critical question entails how joint decision-making influences financial overconfidence.
Overconfidence in Joint Financial Decision-Making
As indicated, there is a notable lack of empirical evidence regarding the impact of joint decision-making on financial overconfidence. Bialowolski, Cwynar, and Weziak-Biolowolska (2020) provide a recent example wherein objective and subjective financial knowledge is compared on a spectrum of sole to joint financial decision-makers within committed romantic relationships (i.e., married and cohabitating couples). Their findings, based on data from 582 Polish couples, suggest that partners who carry less than 50% of the financial decision-making responsibility seem to be significantly less confident in their financial knowledge compared to couples without any partner that claims at least 50% of the responsibility.
However, the presented empirical evidence cannot probe the potential mechanisms behind the reported reduction in subjective financial knowledge among romantic partners who claim less than 50% responsibility. Furthermore, Bialowolski and colleagues do not shed light on decisions made within other relationship types, such as professional or extended family interactions. However, such ties have been shown to play an important role in financial well-being (Gaudecker 2015; Moreland 2018). Lastly, the study found inconsistent evidence of learning in joint decision-making, further supporting the notion that joint decision-making might not be a knowledge-generating process.
A statistically significant and reliably traceable main effect on confidence rather than on knowledge seems to mirror several psychological studies that examine the impact of cooperation on overconfidence in non-financial settings (Bang et al. 2017; Blanchard et al. 2020; Koriat 2015; Schuldt et al. 2017). It should be noted that these studies stand in contrast to the findings of Trouche, Sander, and Mercier (2014) who report an increase in objective knowledge through group discussions. However, their study relies on uncontrollable conversations in an artificial setting that exhibits an excessive degree of variability between and within groups. Participant-led group discussions cannot be scripted, and the subsequently derived data are mainly qualitative more so than quantitative. The next section presents a framework that may help to explain these conflicting findings.
Conceptual Framework and Hypotheses
The aforementioned studies suggest that joint decision-making has a profound impact on confidence. However, the exact nature of the effect seems to depend on the underlying task, group allocation, familiarity with other participants, and so on (Bang et al. 2017; Bialowolski et al. 2020; Keck and Tang 2017; Koriat 2015). Similarly, it is unclear how joint financial decision-making influences a person’s overconfidence and whether such effects would depend on the type of interpersonal ties (i.e., personal vs. professional). This study utilizes the multidimensional benefits of joint financial decision-making to propose a conceptual framework that outlines how interaction influences investor overconfidence (Cross et al. 2001).
The previous discussion on the interplay between joint financial decision-making and investor overconfidence shows that interactive decisions primarily affect confidence rather than objective knowledge. In other words, there seems to be no notable increase in what investors know when involving others in their investment decisions (Bang et al. 2017; Bialowolski et al. 2020; Blanchard et al. 2020; Koriat 2015; Schuldt et al. 2017; Soll, Palley, and Rader 2022). Therefore, it is assumed that joint decision-making has a direct effect on confidence. Given that prior consumer financial research operationalizes overconfidence as an excess between subjective beliefs and objectively measurable knowledge (table 1), joint decision-making should impact investor overconfidence through changes in confidence. As initially stated, little is known about the effect of joint financial decision-making on investor overconfidence. That said, two recent studies suggest that advice aversion in finance is associated with higher overconfidence among Dutch and older Spanish investors (Broekema and Kramer 2021; García, Gómez, and Vila 2022). Since those who refrain from involving others in their financial decisions are more overconfident, it is hypothesized that
H1: Joint financial decision-making decreases investor overconfidence when compared to lone financial decision-making.
However, the nature of the relationship between decision-makers and those who provide input has to be considered. For instance, Mullainathan et al. (2012) show that debiasing is more likely if it is in the professional financial advisor’s best interest. It is not expected that the same would hold for interactions within close relational ties, such as family and friends, because there is no financial incentive to be selective in the sort or quality of advice given. Therefore, the magnitude of the hypothesized effect in hypothesis 1 should be moderated by the type of interaction (i.e., family, friends, etc., vs. financial advisors, bank clerks, and so on). Thus,
H2: Joint financial decision-making within close relational ties has a greater decreasing effect on investor overconfidence than jointly deciding within professional ties.
Importantly, the question of how joint financial decision-making would reduce investor overconfidence remains. The previously discussed five benefit dimensions provide insights into this process. Broadly speaking, they can be placed into two categories: those that can increase overconfidence and those that can have a calibrating effect. The former includes solutions, validation, and legitimation. None of the three dimensions offer sufficient room for reflection that would calibrate a consumer’s decision-making process (Alba and Hutchinson 2000). Considering that validation is expressed as emotional support for a course of action, independent of whether the decision is objectively correct or not, confidence in a decision increases while knowledge remains unaffected by the interaction (Soll et al. 2022). The same is true for validations that figuratively provide a stamp of approval for a given financial decision without reflection or additional input (Cross et al. 2001). While solutions might increase objective knowledge, they have been shown to have a more significant effect on one’s perceived competence and knowledge (Ward 2021).
In contrast, the two remaining dimensions, problem reformulation and metaknowledge, have previously been associated with lower levels of overconfidence (Koriat, Lichtenstein, and Fischhoff 1980; Russo and Schoemaker 1992). In the case of problem reformulation, this seems to stem from an increase in knowledge. This effect has been shown among individuals in a series of experiments using multiple-choice questions (Koriat et al. 1980; Walters et al. 2017). However, one may argue that financial decision-making is more complex than selecting a correct answer out of a set of discrete choices. Consequently, the observable diminishing effect of problem reformulation on investor overconfidence in joint financial decision-making could be notably smaller. Metaknowledge, on the other hand, has been consistently associated with lower overconfidence in real-world situations (Alba and Hutchinson 2000; Russo and Schoemaker 1992). The construct has no impact on objective financial knowledge, but it puts a person’s knowledge into perspective, thereby reducing subjective beliefs (Hadar et al. 2013; Russo and Schoemaker 1992; Walters et al. 2017). Personal interactions seem to foster metaknowledge by making unknown aspects of a decision more salient (Alba and Hutchinson 2000; Cwynar et al. 2020; Russo and Schoemaker 1992; Walters et al. 2017). That is, others can help investors realize what they do not know by sharing the limits of their own financial knowledge (Cwynar et al. 2020, 28). Consequently, it is hypothesized that shared metaknowledge reduces investor overconfidence through the salience of the unknown theory (SUT) (Walters et al. 2017). More formally,
H3:The reduction in investor overconfidence among joint financial decision-makers is mediated by metaknowledge.
These assumed effects are summarized in table 2 and tested in study 3.
ASSUMED EFFECTS OF THE FIVE BENEFIT DIMENSIONS ON OVERCONFIDENCE
| Joint financial decision-making dimension | Impact on investor overconfidence |
|---|---|
| Solutions | + |
| Metaknowledge | − |
| Problem reformulation | − |
| Validation | + |
| Legitimation | + |
| Joint financial decision-making dimension | Impact on investor overconfidence |
|---|---|
| Solutions | + |
| Metaknowledge | − |
| Problem reformulation | − |
| Validation | + |
| Legitimation | + |
NOTES.—“+/−” indicates the assumed increasing/decreasing effect on investor overconfidence.
ASSUMED EFFECTS OF THE FIVE BENEFIT DIMENSIONS ON OVERCONFIDENCE
| Joint financial decision-making dimension | Impact on investor overconfidence |
|---|---|
| Solutions | + |
| Metaknowledge | − |
| Problem reformulation | − |
| Validation | + |
| Legitimation | + |
| Joint financial decision-making dimension | Impact on investor overconfidence |
|---|---|
| Solutions | + |
| Metaknowledge | − |
| Problem reformulation | − |
| Validation | + |
| Legitimation | + |
NOTES.—“+/−” indicates the assumed increasing/decreasing effect on investor overconfidence.
Finally, recall the initial example illustrating the 2021 GameStop predatory short squeeze. Research showed that some retail investors who participated in the stock-buying frenzy initially shorted GameStop stocks before taking a long position (Hasso et al. 2021). Prior studies suggest that such high-risk, high-frequency trading behavior is a manifestation of investor overconfidence (Daniel et al. 2002; Daniel and Hirshleifer 2015; Merkle 2017). However, to take a short position, investors need to have a margin account to sell securities they do not possess, using their own assets as collateral. If prices fall as expected, investors can make a profit (approximately the difference between the sale price of the shorted security and the purchase price after prices fell, minus fees and interest). If prices stagnate or rise, investors might lose some or all of their assets (Santa-Clara and Saretto 2009). In accordance with previous findings, it is hypothesized that:
H4:Overconfident investors have a higher propensity of trading on margin compared to their less overconfident counterparts.
Figure 1 illustrates the presented conceptual framework and all associated hypotheses.
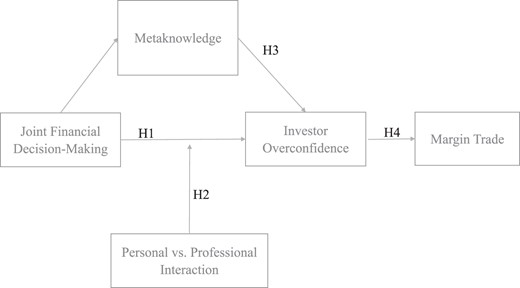
CONCEPTUAL MODEL AND HYPOTHESES

OVERVIEW OF STUDIES
Studies 1 and 2 rely on publicly available datasets that are demographically and regionally representative of the US population. Study 1 included 2,000 investors who were surveyed for the Financial Industry Regulatory Authority’s (FINRA) National Financial Capability Study (FINRA 2015 for further information and data access). The study includes a 10-item investment quiz to assess objective knowledge. The 2,000 observations are used to (1) examine the association between joint financial decision-making and investor overconfidence, (2) assess the robustness of this affiliation, (3) assess causality through semiparametric modeling, and (4) shed light on the suboptimality of overconfidence on investment decisions (hypotheses 1–4). Study 2 uses 6,394 observations from the Financial Well-Being Survey of the Consumer Financial Protection Bureau (CFPB) to split and cross-validate the findings (CFPB 2017 for further information and data access). The survey includes 12 quiz questions to assess financial knowledge. Study 3 (N = 281) tests the five dimensions of joint financial decision-making in a randomized between-subject design with five experimental conditions. The study includes 10 pre-manipulation quiz questions from a US investment bank and the 10 FINRA items from study 1 post-manipulation to assess objective knowledge while reducing demand artifacts. The experiment received institutional ethical approval from the University of Sussex Business School in November 2021. Study 4 is a randomized controlled trial with 376 participants, designed to test the SUT, assessing whether highlighting unknown aspects of an investment decision drives the decreasing effect of joint decision-making on financial overconfidence (hypothesis 3). This study uses the same pre- and post-manipulation quiz questions and received institutional ethical approval from the University of Sussex Business School in January 2020. Both experimental studies were preregistered prior to data collection (i.e., including pilot studies). Data and experimental instruments are publicly available as part of the preregistration. All inclusion and exclusion criteria are provided, and no other qualifiers were used. Data were analyzed in Stata SE 17.
STUDY 1: INVESTOR SAMPLE
The National Financial Capability Study
Data
The first set of estimations builds on the Investor Survey of the 2015 National Financial Capability Study (NFCS). The dataset was collected for FINRA in 2015 and published in late 2016 (FINRA 2015). The descriptive statistics of key variables are summarized in supplementary table 1 in the web appendix. Drawing from a nationally representative dataset of US consumers, this dataset contains 2,000 active investors (44.95% female, median age 55–64, median annual household income $50,000–$99,999) who hold assets in nonretirement funds. Apart from demographics, the variables of interest are whether they self-reportedly work with a financial advisor/broker (56% of the sample) and/or with someone in their household (Q: “Which of the following best describes the situation in your household with regards to investments?” 66.95% A: “I am the primary decision-maker […]”; 33,05%; A:“I share the decision-making responsibility […]”). Subjective investment knowledge was measured with a single indicator (“On a scale from 1 to 7, where 1 means very low and 7 means very high, how would you assess your overall knowledge about Investing?”); 65% rated their investment knowledge between 5 and 7 (i.e., relatively high). This was compared to the outcome of a 10-item investment literacy quiz (e.g., Q: “In general, investments that are riskier tend to provide higher returns over time than investments with less risk,” A: True/False/Don’t know; supplementary table 2 for a complete list). Of all the investors, 56% were unable to provide at least five correct answers.
Overconfidence Measure
As outlined in the previous sections, this study conceptualizes investor overconfidence as the excess between confidence in one’s investment knowledge and objectively measurable knowledge. Moore and Healy (2008) categorize this type of measure as overestimation (i.e., overestimating one’s ability, performance, etc.). Considering these aspects, let with confidence being operationalized in accordance with findings from Hadar et al. (2013, 313) as “a measure or manifestation of SK [subjective knowledge]” and ε being an error of judgment between what consumers think that they know compared to what they actually know. Therefore,
One way to operationalize equation 1 is to take the relative frequency of all correct answers to all substantive responses to the 10-item investment literacy quiz (i.e., excluding all “don’t know” responses in the denominator), resulting in a conservatively calculated percentage of the objective knowledge scale. The summed score is then deducted from an investor’s relative confidence self-assessment to derive a person’s relative overconfidence level (Koehler, Brenner, and Griffin 2002; McClelland and Bolger 1994; Walters et al. 2017). Positive values indicate some degree of overconfidence, zero represents perfect calibration, and a negative score denotes underconfidence. While this approach has been previously used and reflects the domain specificity of the bias, it assumes that subjective financial knowledge and objective financial literacy are drawn from sufficiently similar distributions (de Zwaan et al. 2017; Walters et al. 2017). More importantly, however, this operationalization also assumes that all investment knowledge questions are equally informative. In other words, it assumes that getting a comparably difficult question wrong is just as important in revealing a person’s investment knowledge as answering an easy question incorrectly. In addition, it assumes that all (in this case, 10) questions are sufficiently distinct in nature. Consequently, a more nuanced operationalization is favored over this top-level indicator. However, the described percentage approach (henceforth, naive overconfidence) is used to check the robustness of the results. On average, investors exhibit a naive overconfidence score of 4%, with a standard deviation (SD) of 34%.
This study uses a novel approach that was proposed by Piehlmaier (2022). It builds on Ortoleva and Snowberg (2015, 511) who apply ordinary least squares (OLS) to estimate equation 1, instead of simply taking the difference between confidence and knowledge (henceforth, residual model). In other words, after controlling for a baseline level of confidence and subject matter knowledge, the residual term should accurately reflect overconfidence. However, unlike Ortoleva and Snowberg, it is not assumed that all quiz items are equally informative when constructing a latent knowledge indicator. Instead of employing principal component analysis with all its stochastic restrictions, item response theory (IRT) is utilized to account for the level of difficulty and discrimination (i.e., how different items are from one another) of questions to assign an individual latent (theta) score to each investor to accurately reflect a respondent’s knowledge. IRT is part of the family of latent variable models with likelihood estimators. The model assumes unidimensionality of measured investment knowledge and local independence between quiz items. Prior research suggests that these are justifiable assumptions for the underlying set of financial literacy questions (Knoll and Houts 2012). Since all investors had the option to respond “don’t know” to any given quiz item, no guessing parameter was required. Consequently, a two-parameter IRT [2PL; for location and discrimination, see Nguyen et al. (2014) for an introduction to IRT] was fitted to estimate a person’s latent investment knowledge. The results are shown in supplementary table 2 in the web appendix.
The proposed IRT model uses full information, including all non-substantive responses to the 10 quiz items (supplementary table 1). In other words, every investor receives a latent knowledge score, which is then utilized to regress confidence in one’s investment knowledge. Even a single answer to one of the items results in a valid latent knowledge score, as it fully incorporates discrimination and difficulty parameters from all other respondents. Following Ortoleva and Snowberg (2015), a fourth-order polynomial is used to derive overconfidence through the following auxiliary regression: with confidence representing the 7-point confidence indicator, latent knowledge representing the IRT-derived empirical Bayesian means for theta (henceforth, IRT Knowledge), and ε representing the heteroskedasticity-robust residual overconfidence (henceforth, IRT overconfidence) for participant i. The estimated IRT overconfidence variable is standardized for interpretability [i.e., mean (M) = 0, SD = 1]. The outcomes of the auxiliary regression are reported in supplementary table 4. On average, investors exhibit an IRT overconfidence score of 0, ranging from −3.46 to 1.91. Naive and IRT overconfidence are strongly correlated (r = 0.7).
Results
Differences in Knowledge and Confidence
The first step is to test whether lone investors (31%) and those who invest with the help of others exhibit similar levels of knowledge and confidence. As mentioned above, joint decision-making is hypothesized to decrease investor overconfidence through the calibration of one’s confidence, instead of an increase in one’s knowledge. A t-test using Welch’s (1947) approximation to account for unequal variances suggests that there is no statistically significant difference between the latent investment knowledge (i.e., theta scores) of lone investors and their jointly deciding peers [henceforth two-tailed with joint (MJoint = −0.01)–lone investor (MLone = 0.03) comparison, MDiff = −0.04, standard error (SE) = 0.04, p = .288, d = 0.06]. The same is true if investment knowledge is not considered a latent variable but the percentage of correct answers to the investment knowledge quiz (MJoint = 60.49%, MLone = 59.48%, MDiff = 1.01%, SE = 1.17%, p = .388, d = 0.04). Notably, lone investors are, on average, 10.14% more confident in their investment knowledge than consumers who share financial decisions with others (MJoint = 4.65, MLone = 5.36, MDiff = −0.71, SE = 0.06, p < .001, d = 0.54). These results are in accordance with the proposed theory that joint decision-making calibrates an investor’s confidence instead of increasing their actual knowledge.
Regression Analysis
Next, an OLS regression is utilized to assess the effect of shared financial decision-making (i.e., within a household and/or with a financial advisor) on IRT overconfidence, while controlling for age, gender, education, marital status, income, and ethnicity/race (as non-White and/or Hispanic). Equation 3 formalizes the assumed relationship: where IRT_oc is a continuously distributed dependent variable for the level of overconfidence, using the described residual approach with latent investment knowledge, α is the intercept, ε is the heteroskedasticity-robust error term, and all other variables are binary indicators, for example, for only working with a financial advisor (only_advisor), only sharing financial decisions within a household (only_hh), working with an advisor, and sharing within a household (both). Column (1) of table 3 summarizes the results. The coefficients for all three shared decision-making indicators suggest that investors who make financial decisions in tandem with others can be associated with less-pronounced overconfidence, in line with hypothesis 1. However, the outcome also indicates that not all interactions are equally meaningful. Sharing with a professional advisor seems to have the smallest association with overconfidence, while joint decision-making within a household and with professional help accounts for the largest negative affiliation. Everything else being equal, sharing within a household can be associated with a decrease in investor overconfidence by 0.61 SD. A Wald test strongly suggests that the advisor and household coefficients are not the same (F(1, 1951) = 22.24, p < .001, η2 = 0.01), thus supporting the greater diminishing effect of household interactions in hypothesis 2.
Investor Sample OLS Regression Analyses
| (1) | (2) | (3) | (4) | |
|---|---|---|---|---|
| IRT OC | Naive OC | Confidence | Latent knowl. | |
| Jointly deciding with | ||||
| Household | −0.56*** (0.08) | −0.14*** (0.03) | −0.84*** (0.11) | −0.05 (0.06) |
| Advisor | −0.19*** (0.05) | −0.06*** (0.02) | −0.38*** (0.07) | −0.08 (0.04) |
| Both | −0.61*** (0.06) | −0.13*** (0.02) | −0.99*** (0.09) | −0.21*** (0.05) |
| Age 35–54 | −0.15* (0.07) | −0.13*** (0.02) | −0.29** (0.09) | 0.30*** (0.05) |
| Age 55+ | −0.30*** (0.06) | −0.26*** (0.02) | −0.50*** (0.09) | 0.66*** (0.05) |
| Female | −0.21*** (0.04) | −0.02 (0.02) | −0.35*** (0.06) | −0.23*** (0.03) |
| Bachelor+ | −0.04 (0.05) | −0.09*** (0.02) | −0.03 (0.06) | 0.31*** (0.03) |
| Married | 0.22*** (0.05) | 0.08*** (0.02) | 0.32*** (0.07) | −0.07 (0.04) |
| Inc $50,000–99,999 | 0.15* (0.06) | 0.03 (0.02) | 0.21* (0.09) | 0.09* (0.04) |
| Inc $100,000+ | 0.31*** (0.07) | 0.02 (0.02) | 0.46*** (0.09) | 0.29*** (0.05) |
| Minority | 0.17** (0.05) | 0.08*** (0.02) | 0.22** (0.07) | −0.18*** (0.04) |
| Intercept | 0.24** (0.08) | 0.26*** (0.03) | 5.33*** (0.12) | −0.50*** (0.06) |
| Observations | 1,963 | 1,951 | 1,963 | 1,972 |
| R2 | 0.12 | 0.15 | 0.15 | 0.22 |
| (1) | (2) | (3) | (4) | |
|---|---|---|---|---|
| IRT OC | Naive OC | Confidence | Latent knowl. | |
| Jointly deciding with | ||||
| Household | −0.56*** (0.08) | −0.14*** (0.03) | −0.84*** (0.11) | −0.05 (0.06) |
| Advisor | −0.19*** (0.05) | −0.06*** (0.02) | −0.38*** (0.07) | −0.08 (0.04) |
| Both | −0.61*** (0.06) | −0.13*** (0.02) | −0.99*** (0.09) | −0.21*** (0.05) |
| Age 35–54 | −0.15* (0.07) | −0.13*** (0.02) | −0.29** (0.09) | 0.30*** (0.05) |
| Age 55+ | −0.30*** (0.06) | −0.26*** (0.02) | −0.50*** (0.09) | 0.66*** (0.05) |
| Female | −0.21*** (0.04) | −0.02 (0.02) | −0.35*** (0.06) | −0.23*** (0.03) |
| Bachelor+ | −0.04 (0.05) | −0.09*** (0.02) | −0.03 (0.06) | 0.31*** (0.03) |
| Married | 0.22*** (0.05) | 0.08*** (0.02) | 0.32*** (0.07) | −0.07 (0.04) |
| Inc $50,000–99,999 | 0.15* (0.06) | 0.03 (0.02) | 0.21* (0.09) | 0.09* (0.04) |
| Inc $100,000+ | 0.31*** (0.07) | 0.02 (0.02) | 0.46*** (0.09) | 0.29*** (0.05) |
| Minority | 0.17** (0.05) | 0.08*** (0.02) | 0.22** (0.07) | −0.18*** (0.04) |
| Intercept | 0.24** (0.08) | 0.26*** (0.03) | 5.33*** (0.12) | −0.50*** (0.06) |
| Observations | 1,963 | 1,951 | 1,963 | 1,972 |
| R2 | 0.12 | 0.15 | 0.15 | 0.22 |
NOTES.—Unstandardized coefficients. Robust standard errors are in parentheses. OC: overconfidence. DVs in columns (1), (2), and (4) are based on the 10-item investment quiz. DV in column (3) is based on a 7-point Likert scale. The number of missing cases never exceeds 2.45%, which is insufficient to significantly bias the results (Little et al. 2014). A multiple imputation chained equation method with predictive mean matching, 5 nearest neighbors, and 10 imputed datasets yields virtually identical results.
p < .001
p < .01
p < .05.
Investor Sample OLS Regression Analyses
| (1) | (2) | (3) | (4) | |
|---|---|---|---|---|
| IRT OC | Naive OC | Confidence | Latent knowl. | |
| Jointly deciding with | ||||
| Household | −0.56*** (0.08) | −0.14*** (0.03) | −0.84*** (0.11) | −0.05 (0.06) |
| Advisor | −0.19*** (0.05) | −0.06*** (0.02) | −0.38*** (0.07) | −0.08 (0.04) |
| Both | −0.61*** (0.06) | −0.13*** (0.02) | −0.99*** (0.09) | −0.21*** (0.05) |
| Age 35–54 | −0.15* (0.07) | −0.13*** (0.02) | −0.29** (0.09) | 0.30*** (0.05) |
| Age 55+ | −0.30*** (0.06) | −0.26*** (0.02) | −0.50*** (0.09) | 0.66*** (0.05) |
| Female | −0.21*** (0.04) | −0.02 (0.02) | −0.35*** (0.06) | −0.23*** (0.03) |
| Bachelor+ | −0.04 (0.05) | −0.09*** (0.02) | −0.03 (0.06) | 0.31*** (0.03) |
| Married | 0.22*** (0.05) | 0.08*** (0.02) | 0.32*** (0.07) | −0.07 (0.04) |
| Inc $50,000–99,999 | 0.15* (0.06) | 0.03 (0.02) | 0.21* (0.09) | 0.09* (0.04) |
| Inc $100,000+ | 0.31*** (0.07) | 0.02 (0.02) | 0.46*** (0.09) | 0.29*** (0.05) |
| Minority | 0.17** (0.05) | 0.08*** (0.02) | 0.22** (0.07) | −0.18*** (0.04) |
| Intercept | 0.24** (0.08) | 0.26*** (0.03) | 5.33*** (0.12) | −0.50*** (0.06) |
| Observations | 1,963 | 1,951 | 1,963 | 1,972 |
| R2 | 0.12 | 0.15 | 0.15 | 0.22 |
| (1) | (2) | (3) | (4) | |
|---|---|---|---|---|
| IRT OC | Naive OC | Confidence | Latent knowl. | |
| Jointly deciding with | ||||
| Household | −0.56*** (0.08) | −0.14*** (0.03) | −0.84*** (0.11) | −0.05 (0.06) |
| Advisor | −0.19*** (0.05) | −0.06*** (0.02) | −0.38*** (0.07) | −0.08 (0.04) |
| Both | −0.61*** (0.06) | −0.13*** (0.02) | −0.99*** (0.09) | −0.21*** (0.05) |
| Age 35–54 | −0.15* (0.07) | −0.13*** (0.02) | −0.29** (0.09) | 0.30*** (0.05) |
| Age 55+ | −0.30*** (0.06) | −0.26*** (0.02) | −0.50*** (0.09) | 0.66*** (0.05) |
| Female | −0.21*** (0.04) | −0.02 (0.02) | −0.35*** (0.06) | −0.23*** (0.03) |
| Bachelor+ | −0.04 (0.05) | −0.09*** (0.02) | −0.03 (0.06) | 0.31*** (0.03) |
| Married | 0.22*** (0.05) | 0.08*** (0.02) | 0.32*** (0.07) | −0.07 (0.04) |
| Inc $50,000–99,999 | 0.15* (0.06) | 0.03 (0.02) | 0.21* (0.09) | 0.09* (0.04) |
| Inc $100,000+ | 0.31*** (0.07) | 0.02 (0.02) | 0.46*** (0.09) | 0.29*** (0.05) |
| Minority | 0.17** (0.05) | 0.08*** (0.02) | 0.22** (0.07) | −0.18*** (0.04) |
| Intercept | 0.24** (0.08) | 0.26*** (0.03) | 5.33*** (0.12) | −0.50*** (0.06) |
| Observations | 1,963 | 1,951 | 1,963 | 1,972 |
| R2 | 0.12 | 0.15 | 0.15 | 0.22 |
NOTES.—Unstandardized coefficients. Robust standard errors are in parentheses. OC: overconfidence. DVs in columns (1), (2), and (4) are based on the 10-item investment quiz. DV in column (3) is based on a 7-point Likert scale. The number of missing cases never exceeds 2.45%, which is insufficient to significantly bias the results (Little et al. 2014). A multiple imputation chained equation method with predictive mean matching, 5 nearest neighbors, and 10 imputed datasets yields virtually identical results.
p < .001
p < .01
p < .05.
All demographic effects are largely in line with prior research (Albaity and Rahman 2012; Bhandari and Deaves 2006; Kovalchik et al. 2005). On average, an overconfident investor is a young, married, male, lone decision-maker with a high household income who self-identifies as non-White/non-Caucasian.
Robustness Check
Column (1) utilizes the previously described IRT overconfidence indicator. This assumes that investment knowledge is a latent variable that cannot be directly observed by a set of quiz questions. IRT builds on the assumption that not all items are equally meaningful. However, this may be challenged by using the aforementioned naive overconfidence measure. This variable reflects the difference between relative confidence and relative accuracy. In other words, the percentage of correctly answered investment quiz questions was subtracted from relative confidence which was adjusted to be on the same scale as objective knowledge, expressed as a percentage, ranging from 0 to 1 (supplementary table 1 in the web appendix for descriptive statistics). This operationalization replaces IRT overconfidence in equation 3. The results presented in table 3 show no meaningful difference between an OLS model using the novel IRT approach and the more simplistic relative difference measure. The central hypotheses are supported by the findings in column (2). Specifically, all types of joint decision-making are negatively associated with investor overconfidence (hypothesis 1). Furthermore, sharing within a household seems to have a more negative coefficient (c.p., an affiliated 14% reduction in overconfidence) compared to professional financial advice (F(1, 1939) = 9.55, p = .002, η2 = 0.00). The validity of these claims can be verified using the full NFCS. Specifically, the 10 investor quiz questions can be swapped with 10 general financial knowledge questions. Replacing both subjective and objective knowledge does not alter the reported findings (supplementary table 5), thereby providing an additional layer of support in favor of hypotheses 1 and 2.
Separating Confidence and Knowledge
Columns (3) and (4) of table 3 replace IRT overconfidence with confidence in one’s investment knowledge and latent investment knowledge (i.e., the IRT-based theta score) in equation 3, respectively. The two OLS regressions provide additional insights into the underlying process of reduced overconfidence among joint decision-makers. Independent of whether investors involve only close relational ties, only professional advisors, or a combination of both, joint decision-makers are associated with significantly lower confidence in their investment knowledge compared to lone investors. However, only those who seek input from both personal and professional sources seem to be significantly less knowledgeable than lone decision-makers. In other words, there is a consistent association between joint financial decision-making and lower confidence. No such consistency is found for knowledge. This is in line with the previously presented results from a series of unpaired t-tests and supports the notion that joint financial decision-making is not primarily a knowledge-generating process.
Causality Check
A crucial caveat concerning all these results is the lack of causal inference thus far. The investor sample of the NFCS is a cross-section, and the reported OLS regressions do not offer insights into developing trends. However, the dataset provides a prime opportunity to apply a combination of nonparametric matching and parametric estimation to shed light on the causal direction of the proposed effect of joint decision-making on investor overconfidence. That is to say, the procedure seeks to answer the question of whether financial decision-making with the input of others reduces investor overconfidence, as theoretically proposed in this article, or whether less overconfident consumers are per se more likely to seek the help of others.
In a simple randomized controlled trial, sufficiently similar individuals (i.e., drawn from the same underlying distribution) are assigned to two groups by chance, and only one group receives a treatment. This can be replicated with a quasi-experiment in which lone investors are randomly matched with demographically similar joint decision-makers using a nonparametric nearest neighbor matching function (Imbens 2004). The hypothesized effect of the treatment, in this case joint versus lone financial decision-making, is then assessed using average treatment effects (Abadie et al. 2004; Angrist and Imbens 1995). In essence, the procedure estimates a counterfactual scenario in which everyone is a lone investor and compares it to the factually observable outcome of their nearest demographic neighbors who jointly handle financial matters. It is important to note that the applied matching function relies on a set of observed variables, and the procedure may introduce omitted variable bias if sufficiently uncorrelated unobserved confounders influence the assumed relation. For instance, if the effect of joint financial decision-making on investor overconfidence was significantly mediated by a person’s level of extroversion and if the personality trait was only weakly correlated with the included demographic variables, the derived average treatment effects would be unreliable. Studies 3 and 4 address this issue using a randomized experimental approach.
Formally, the distance metric for matching these nearest neighbors followed a Mahalanobis inverse sample covariate covariance (De Maesschalck, Jouan-Rimbaud, and Massart 2000). Exact matches are required for gender, age, education, and ethnicity because of their theoretical and empirical importance (table 3 and supplementary table 5). In other words, matched lone investors and their jointly deciding peers are identical in these four dimensions. Income and marital status are used for the approximate similarity. All variables are bias-adjusted to account for large sample sizes. Furthermore, heteroscedasticity-robust SEs are applied.
The results suggest that a lone investment style causally increases IRT overconfidence in one’s investment knowledge by .36 SD (SE = 0.06, p < .001, 95% confidence interval [CI] [0.24; 0.47]) and naive investor overconfidence by 9% (SE = 1.97%, p < .001, 95% CI [5.34%; 12.87%]) across all investors. The same holds for IRT overconfidence in one’s financial knowledge and naive financial overconfidence (study 1 in the web appendix). All distance measures are sufficiently normally distributed (supplementary panel 1 in the web appendix), indicating a successful and appropriate matching process. The presented findings show a consistent and robust pattern; not receiving the treatment of joint financial decision-making causally increases overconfidence among investors in a statistically highly significant and economically meaningful fashion (hypothesis 1). Using nonparametric matching to estimate average treatment effects works specifically well in this case because a smaller number of lone investors (31%) can be matched with a larger sample of joint decision-makers. This guarantees that even with several exact matching criteria, every lone investor has a sufficiently large number of nearest neighbors to be matched with.
The sensitivity of this approach can be checked by applying a multivalued treatment effects model. In this case, the treatment variable is categorical instead of binary, with lone financial decision-makers serving as baseline group. Specifically, an augmented inverse propensity weighted estimation with a linear outcome model and a multinomial logistic treatment model using the same control variables and heteroskedasticity-robust SEs was fitted (Glynn and Quinn 2010). Jointly deciding exclusively with household members reduces IRT overconfidence by .69 SD (SE = .08, p < .001, 95% CI [−.85; −.52]) compared to lone investors. Similarly, sharing financial decision-making with a professional advisor and close relational ties decreases IRT overconfidence by .39 SD (SE = .09, p < .001, 95% CI [−.56; −.21]). In contrast, only involving professional financial advice does not seem to have a statistically significant impact on IRT overconfidence (p = .96). Lastly, lone decision-makers are, on average, more overconfident (Coef. = .28 SD, SE = .04, p < .001, 95% CI [.20; .36]). Changing the model to a more simplistic adjusted regression yields virtually identical results. The findings underline the robustness of the quasi-experimental approach and provide further support in favor of hypotheses 1 and 2.
Financial Consequences of Investor Overconfidence
The previous sections outline the presence and magnitude of investor overconfidence among lone and jointly deciding investors. While there is ample prior evidence that investor overconfidence leads to suboptimal financial decisions (Daniel, Hirshleifer, and Subrahmanyam 2001; Daniel et al. 2002; Daniel and Hirshleifer 2015), up to this point, the reported findings do not address this suboptimality for the representative NFCS sample. Trading on margin has been identified as a risky financial instrument that is widely available to private investors (Santa-Clara and Saretto 2009). Borrowing money to purchase securities offers ill-informed and excessively confident consumers an opportunity to amplify the consequences of good and bad investment calls. Yet, the latter may lead to severe monetary repercussions, especially when fueled by overconfidence in one’s investment knowledge.
The NFCS Investor Sample offers insights into this type of risky financial behavior. It may be worth repeating that 56% of all sampled investors were unable to provide at least five correct answers to the 10-item investment quiz. However, 15% indicated that they had previously traded on margin (Q: “Have you made any securities purchases on margin?” A: “Yes/No/Don’t know/Prefer not to say”). Since opening a margin account and trading on margin are both deliberate actions that require an initial credit check and given the fact that any such action would incur a range of fees, “don’t know” responses are coded as not having executed such purchases in the past. In contrast, “prefer not to say” responses are treated as missing because the real status is unknown (8 respondents preferred not to disclose whether they have such an account and 16 do not reveal whether they have traded on margin, yielding a total of 1.2% missing cases). A maximum likelihood model with heteroskedasticity-robust SEs is fitted to estimate the propensity of engaging in this type of risky financial behavior using a logit link:
Odds ratios are reported in table 4. The findings indicate that both overconfidence and lone decision-making can be associated with substantially higher odds of having purchased securities on margin in the past. This holds independent of the operationalization of the bias (supplementary table 6). The results are in line with prior research on the interplay between overconfidence and the willingness to engage in risky financial behavior as well as with the aforementioned definition of overconfidence as an underestimation of risk and ambiguity (Adebambo and Yan 2017; Merkle 2017; Xia, Wang, and Li 2014). These findings support hypothesis 4. Apart from the bias, the outcomes of the models suggest that older investors have significantly lower odds of borrowing money to buy securities across all four models.
Investor Sample Odds Ratios for Margin Trade
| Dependent variable | (1) | (2) |
|---|---|---|
| Margin trade | IRT OC | Naive OC |
| Overconfidence | 3.28*** (0.39) | 30.46*** (8.50) |
| Lone investor | 2.11*** (0.32) | 2.31*** (0.36) |
| Age 35–54 | 0.51*** (0.09) | 0.65* (0.12) |
| Age 55+ | 0.16*** (0.03) | 0.27*** (0.06) |
| Female | 0.84 (0.13) | 0.68* (0.11) |
| Bachelor+ | 1.28 (0.21) | 1.67** (0.27) |
| Married | 1.47* (0.26) | 1.24 (0.22) |
| Inc $50,000–99,999 | 1.11 (0.24) | 1.38 (0.31) |
| Inc $100,000+ | 0.93 (0.22) | 1.51 (0.37) |
| Minority | 1.52* (0.26) | 1.37 (0.24) |
| Intercept | 0.13*** (0.04) | 0.07*** (0.02) |
| Observations | 1,964 | 1,950 |
| Pseudo R2 | 0.27 | 0.28 |
| Dependent variable | (1) | (2) |
|---|---|---|
| Margin trade | IRT OC | Naive OC |
| Overconfidence | 3.28*** (0.39) | 30.46*** (8.50) |
| Lone investor | 2.11*** (0.32) | 2.31*** (0.36) |
| Age 35–54 | 0.51*** (0.09) | 0.65* (0.12) |
| Age 55+ | 0.16*** (0.03) | 0.27*** (0.06) |
| Female | 0.84 (0.13) | 0.68* (0.11) |
| Bachelor+ | 1.28 (0.21) | 1.67** (0.27) |
| Married | 1.47* (0.26) | 1.24 (0.22) |
| Inc $50,000–99,999 | 1.11 (0.24) | 1.38 (0.31) |
| Inc $100,000+ | 0.93 (0.22) | 1.51 (0.37) |
| Minority | 1.52* (0.26) | 1.37 (0.24) |
| Intercept | 0.13*** (0.04) | 0.07*** (0.02) |
| Observations | 1,964 | 1,950 |
| Pseudo R2 | 0.27 | 0.28 |
NOTES.—Unstandardized coefficients. The models are based on a logit link. Robust standard errors in parentheses. Columns (1) and (2) are based on the 10-item investment quiz, and the number of missing cases never exceeds 2.50%, which is insufficient to significantly bias the results (Little et al. 2014).
p < .001
p < .01
p < .05.
Investor Sample Odds Ratios for Margin Trade
| Dependent variable | (1) | (2) |
|---|---|---|
| Margin trade | IRT OC | Naive OC |
| Overconfidence | 3.28*** (0.39) | 30.46*** (8.50) |
| Lone investor | 2.11*** (0.32) | 2.31*** (0.36) |
| Age 35–54 | 0.51*** (0.09) | 0.65* (0.12) |
| Age 55+ | 0.16*** (0.03) | 0.27*** (0.06) |
| Female | 0.84 (0.13) | 0.68* (0.11) |
| Bachelor+ | 1.28 (0.21) | 1.67** (0.27) |
| Married | 1.47* (0.26) | 1.24 (0.22) |
| Inc $50,000–99,999 | 1.11 (0.24) | 1.38 (0.31) |
| Inc $100,000+ | 0.93 (0.22) | 1.51 (0.37) |
| Minority | 1.52* (0.26) | 1.37 (0.24) |
| Intercept | 0.13*** (0.04) | 0.07*** (0.02) |
| Observations | 1,964 | 1,950 |
| Pseudo R2 | 0.27 | 0.28 |
| Dependent variable | (1) | (2) |
|---|---|---|
| Margin trade | IRT OC | Naive OC |
| Overconfidence | 3.28*** (0.39) | 30.46*** (8.50) |
| Lone investor | 2.11*** (0.32) | 2.31*** (0.36) |
| Age 35–54 | 0.51*** (0.09) | 0.65* (0.12) |
| Age 55+ | 0.16*** (0.03) | 0.27*** (0.06) |
| Female | 0.84 (0.13) | 0.68* (0.11) |
| Bachelor+ | 1.28 (0.21) | 1.67** (0.27) |
| Married | 1.47* (0.26) | 1.24 (0.22) |
| Inc $50,000–99,999 | 1.11 (0.24) | 1.38 (0.31) |
| Inc $100,000+ | 0.93 (0.22) | 1.51 (0.37) |
| Minority | 1.52* (0.26) | 1.37 (0.24) |
| Intercept | 0.13*** (0.04) | 0.07*** (0.02) |
| Observations | 1,964 | 1,950 |
| Pseudo R2 | 0.27 | 0.28 |
NOTES.—Unstandardized coefficients. The models are based on a logit link. Robust standard errors in parentheses. Columns (1) and (2) are based on the 10-item investment quiz, and the number of missing cases never exceeds 2.50%, which is insufficient to significantly bias the results (Little et al. 2014).
p < .001
p < .01
p < .05.
However, as previously mentioned, the findings in table 4 do not provide an answer to the question of whether overconfidence causally increases the likelihood of trading on margin. By replicating the nearest neighbor matching procedure to estimate the average treatment effect of a median split for high IRT overconfidence (50.13% of all investors), it is possible to conclude with a high degree of certainty (p < .001) that above-average investor overconfidence increases the likelihood of picking up margin trade by 13.91% (SE = 1.61%, 95% CI [10.76%; 17.06%]).
Exact matches are required for lone investors, age, and ethnicity. The approximate similarity is fitted for gender, education, income, and marital status. All variables are bias-adjusted for large sample sizes, and the model relies on heteroskedasticity-robust SEs. The distance measure is sufficiently normally distributed, ranging from −1.06 to 1.08 (M = .14, SD = .38).
Discussion
In summary, study 1 finds consistent support in favor of hypotheses 1, 2, and 4. Joint decision-making appears to cause a decrease in investor overconfidence, independent of the operationalization of the bias (hypothesis 1). The type of joint decision-making (i.e., personal vs. professional) moderates this effect. That is to say, sharing with someone in the household has a significantly greater diminishing effect on the bias than professional financial advice (hypothesis 2). Both hypotheses are supported across four sufficiently independent overconfident measures. Lastly, overconfidence seems to causally increase the likelihood of purchasing securities on margin (hypothesis 4). Above-average levels of excessive investor confidence seem to increase the chances of borrowing money to purchase securities by more than 13%. However, the presented findings rely on a single nationally representative dataset. Unobservable measurement errors during data collection or other empirical artifacts may bias the outcomes of the models. Therefore, study 2 is conducted to cross-validate the results.
STUDY 2: CONSUMER SAMPLE
The National Financial Well-Being Survey
Data
The National Financial Well-Being Survey was commissioned by the CFPB and collected between October and December 2016. The nationally representative sample consists of 6,394 adults from the 50 US states and the District of Columbia (47.58% female, median age 53, median annual US household income $60,000–$74,999), 999 of whom are from an oversampled population aged 62 years and older (CFPB 2017). Of initial interest are 2,012 respondents who indicate that they hold non-retirement assets, such as stocks, bonds, or mutual funds. These observations offer a prime opportunity to cross-validate the results from study 1 with an independently collected, yet comparable representative sample. A descriptive summary of all key variables of the publicly available dataset can be found in supplementary table 7 in the web appendix. The survey allows controlling for the same set of regressors with the notable distinction that it includes a more detailed picture of age, income, education (less than high school, high school, some college, bachelor, and graduate/professional degree), and race/ethnicity (Black/non-Hispanic, White/non-Hispanic, other/non-Hispanic, and Hispanic/any race). In addition, the dataset allows the assessment of the same shared financial decision-making indicators included in the investor sample (i.e., only spouse, family, and friends: 25%; only bank or financial advisor: 20%; both: 41%).
Overconfidence Measure
IRT and naive overconfidence are measured as described in study 1. Subjective financial knowledge is indicated by the same 7-point scale (Q: “How would you assess your overall financial knowledge?”). Furthermore, objective financial literacy is determined by (1) a 10-item short version of an IRT-based financial knowledge scale and (2) a 3-item financial literacy module (e.g., Q: “Imagine that the interest rate on your savings account was 1% per year and inflation was 2% per year. After 1 year, would you be able to buy more than, exactly the same as, or less than today with the money in this account?”) [CFPB 2017, 32; Knoll and Houts 2012, 399, 400 (KH); Lusardi and Mitchell 2008, 414 (LM), respectively].1 The combination of two externally valid scales promises to provide a more robust assessment of objective financial literacy, for example, against possible framing effects in individual questions (Biswas, Zhao, and Lehmann 2011). It also offers an opportunity to test the validity of the four overconfidence measures that are used to analyze the investor sample in study 1 (table 3 and supplementary table 5). The aforementioned example question is included in both scales (i.e., KH and LM), which reduce the total number of unique items to 12. The items as well as their IRT difficulty and discrimination parameters are reported in supplementary table 8 in the web appendix. The results for the residual model are presented in supplementary table 3. On average, investors in the consumer sample exhibit overconfidence in their financial literacy with a mean IRT score of 0.21, ranging from −3.80 to 2.28.
Results
Differences in Knowledge and Confidence
The first step is to test whether lone investors illustrate any detectable difference in financial knowledge, compared with their jointly deciding peers. This does not seem to be the case for latent financial knowledge (two-tailed Welch’s approximation, as indicated in study 1: MJoint = 0.46, MLone = 0.39, MDiff = 0.07, SE = 0.05, p = .128, d = 0.17) or the percentage of correct responses to the 12-item financial literacy battery (MJoint = 84.46% MLone = 83.20%, MDiff = 1.26%, SE = 1.04%, p = .226, d = 0.09). However, sole decision-makers exhibit significantly higher confidence in their financial knowledge, as supposed to jointly deciding investors (MJoint = 5.11, MLone = 5.25, MDiff = −0.14, SE = 0.07, p = .047, d = 0.14). These findings independently confirm that joint financial decision-making does not seem to influence an investor’s knowledge but rather a person’s confidence in the subject matter knowledge. This is consistent with study 1 and provides additional empirical support in favor of the proposed theoretical framework.
Regression Analyses
To cross-validate the findings in study 1, an initial regression analysis with the previously described IRT overconfidence measure is fitted. Equation 5 formalizes the hypothesized interaction with the aforementioned joint decision-making and demographic variables using an OLS regression: where IRT_oc is the standardized and continuously distributed IRT overconfidence score, α is the intercept, age and income are continuous variables for years of age and household income, education is a categorical variable for educational attainment, ethnicity/race is a categorical indicator for ethnic/racial identity, and ε is the error term; all other variables are binary indicators, for example, for seeking advice on matters involving money from financial institutions or professional advisors/planner/counselor (bank_prof), consulting a parent, spouse/partner, extended family member, or a friend/co-worker (family_friends). The results are reported in column (1) of table 5. The findings reaffirm the decreasing association between joint decision-making and overconfidence among 2,000 active investors (12 missing) in the consumer sample (hypothesis 1). It also underlines that while interactions within close ties can be attributed to a statistically significant reduction in overconfidence, the same cannot be said about professional ties (hypothesis 2). That said, a statistically significantly decreasing effect of professional advice on naive investor overconfidence is recovered in column (2). The profile of an average overconfident investor appears to be male, lone decision-making, highly educated, well-off, and Black/non-Hispanic. In line with study 1, robustness and validity can be checked with naive overconfidence (as defined in study 1) in table 5, column (2), and the full sample of 6,326 consumers (supplementary table 9), respectively.
Consumer Sample OLS Regression Analyses
| (1) | (2) | (3) | (4) | |
|---|---|---|---|---|
| IRT OC | Naive OC | Confidence | Latent knowl. | |
| Jointly deciding with | ||||
| Bank/advisor | −0.11 (0.07) | −0.04* (0.02) | −0.10 (0.08) | 0.10* (0.05) |
| Family/friends | −0.20** (0.07) | −0.05** (0.02) | −0.23** (0.08) | 0.06 (0.05) |
| Both | −0.16** (0.06) | −0.06*** (0.01) | −0.14* (0.07) | 0.17*** (0.05) |
| Age | 0.00 (0.00) | −0.00** (0.00) | 0.00** (0.00) | 0.01*** (0.00) |
| Female | −0.11** (0.04) | 0.02 (0.01) | −0.27*** (0.04) | −0.30*** (0.03) |
| Education | ||||
| High school | 0.36 (0.23) | 0.02 (0.06) | 0.50 (0.25) | 0.34* (0.14) |
| Some college | 0.43 (0.22) | 0.02 (0.06) | 0.61* (0.25) | 0.44** (0.14) |
| Bachelor’s | 0.48* (0.22) | 0.00 (0.06) | 0.77** (0.25) | 0.64*** (0.14) |
| Graduate/professional | 0.57* (0.22) | 0.03 (0.06) | 0.88*** (0.25) | 0.65*** (0.14) |
| Married | 0.04 (0.05) | 0.01 (0.01) | 0.04 (0.05) | −0.00 (0.03) |
| Income | 0.02* (0.01) | −0.00 (0.00) | 0.03*** (0.01) | 0.03*** (0.00) |
| Ethnicity/race | ||||
| Black, non-Hispanic | 0.27** (0.09) | 0.12*** (0.02) | 0.14 (0.11) | −0.43*** (0.06) |
| Other, non-Hispanic | −0.14 (0.09) | −0.03 (0.02) | −0.17 (0.10) | −0.01 (0.06) |
| Hispanic | 0.16 (0.09) | 0.10*** (0.02) | 0.05 (0.10) | −0.37*** (0.07) |
| Intercept | −0.46 (0.26) | −0.08 (0.07) | 3.91*** (0.29) | −0.80*** (0.15) |
| Observations | 2,000 | 1,997 | 2,000 | 2,012 |
| R2 | 0.04 | 0.05 | 0.09 | 0.24 |
| (1) | (2) | (3) | (4) | |
|---|---|---|---|---|
| IRT OC | Naive OC | Confidence | Latent knowl. | |
| Jointly deciding with | ||||
| Bank/advisor | −0.11 (0.07) | −0.04* (0.02) | −0.10 (0.08) | 0.10* (0.05) |
| Family/friends | −0.20** (0.07) | −0.05** (0.02) | −0.23** (0.08) | 0.06 (0.05) |
| Both | −0.16** (0.06) | −0.06*** (0.01) | −0.14* (0.07) | 0.17*** (0.05) |
| Age | 0.00 (0.00) | −0.00** (0.00) | 0.00** (0.00) | 0.01*** (0.00) |
| Female | −0.11** (0.04) | 0.02 (0.01) | −0.27*** (0.04) | −0.30*** (0.03) |
| Education | ||||
| High school | 0.36 (0.23) | 0.02 (0.06) | 0.50 (0.25) | 0.34* (0.14) |
| Some college | 0.43 (0.22) | 0.02 (0.06) | 0.61* (0.25) | 0.44** (0.14) |
| Bachelor’s | 0.48* (0.22) | 0.00 (0.06) | 0.77** (0.25) | 0.64*** (0.14) |
| Graduate/professional | 0.57* (0.22) | 0.03 (0.06) | 0.88*** (0.25) | 0.65*** (0.14) |
| Married | 0.04 (0.05) | 0.01 (0.01) | 0.04 (0.05) | −0.00 (0.03) |
| Income | 0.02* (0.01) | −0.00 (0.00) | 0.03*** (0.01) | 0.03*** (0.00) |
| Ethnicity/race | ||||
| Black, non-Hispanic | 0.27** (0.09) | 0.12*** (0.02) | 0.14 (0.11) | −0.43*** (0.06) |
| Other, non-Hispanic | −0.14 (0.09) | −0.03 (0.02) | −0.17 (0.10) | −0.01 (0.06) |
| Hispanic | 0.16 (0.09) | 0.10*** (0.02) | 0.05 (0.10) | −0.37*** (0.07) |
| Intercept | −0.46 (0.26) | −0.08 (0.07) | 3.91*** (0.29) | −0.80*** (0.15) |
| Observations | 2,000 | 1,997 | 2,000 | 2,012 |
| R2 | 0.04 | 0.05 | 0.09 | 0.24 |
NOTES.—Unstandardized coefficients. OC: overconfidence. The models are based on an investor subsample. The number of missing cases never exceeds 0.7%. Robust standard errors are in parentheses.
p < .001
p < .01
p < .05.
Consumer Sample OLS Regression Analyses
| (1) | (2) | (3) | (4) | |
|---|---|---|---|---|
| IRT OC | Naive OC | Confidence | Latent knowl. | |
| Jointly deciding with | ||||
| Bank/advisor | −0.11 (0.07) | −0.04* (0.02) | −0.10 (0.08) | 0.10* (0.05) |
| Family/friends | −0.20** (0.07) | −0.05** (0.02) | −0.23** (0.08) | 0.06 (0.05) |
| Both | −0.16** (0.06) | −0.06*** (0.01) | −0.14* (0.07) | 0.17*** (0.05) |
| Age | 0.00 (0.00) | −0.00** (0.00) | 0.00** (0.00) | 0.01*** (0.00) |
| Female | −0.11** (0.04) | 0.02 (0.01) | −0.27*** (0.04) | −0.30*** (0.03) |
| Education | ||||
| High school | 0.36 (0.23) | 0.02 (0.06) | 0.50 (0.25) | 0.34* (0.14) |
| Some college | 0.43 (0.22) | 0.02 (0.06) | 0.61* (0.25) | 0.44** (0.14) |
| Bachelor’s | 0.48* (0.22) | 0.00 (0.06) | 0.77** (0.25) | 0.64*** (0.14) |
| Graduate/professional | 0.57* (0.22) | 0.03 (0.06) | 0.88*** (0.25) | 0.65*** (0.14) |
| Married | 0.04 (0.05) | 0.01 (0.01) | 0.04 (0.05) | −0.00 (0.03) |
| Income | 0.02* (0.01) | −0.00 (0.00) | 0.03*** (0.01) | 0.03*** (0.00) |
| Ethnicity/race | ||||
| Black, non-Hispanic | 0.27** (0.09) | 0.12*** (0.02) | 0.14 (0.11) | −0.43*** (0.06) |
| Other, non-Hispanic | −0.14 (0.09) | −0.03 (0.02) | −0.17 (0.10) | −0.01 (0.06) |
| Hispanic | 0.16 (0.09) | 0.10*** (0.02) | 0.05 (0.10) | −0.37*** (0.07) |
| Intercept | −0.46 (0.26) | −0.08 (0.07) | 3.91*** (0.29) | −0.80*** (0.15) |
| Observations | 2,000 | 1,997 | 2,000 | 2,012 |
| R2 | 0.04 | 0.05 | 0.09 | 0.24 |
| (1) | (2) | (3) | (4) | |
|---|---|---|---|---|
| IRT OC | Naive OC | Confidence | Latent knowl. | |
| Jointly deciding with | ||||
| Bank/advisor | −0.11 (0.07) | −0.04* (0.02) | −0.10 (0.08) | 0.10* (0.05) |
| Family/friends | −0.20** (0.07) | −0.05** (0.02) | −0.23** (0.08) | 0.06 (0.05) |
| Both | −0.16** (0.06) | −0.06*** (0.01) | −0.14* (0.07) | 0.17*** (0.05) |
| Age | 0.00 (0.00) | −0.00** (0.00) | 0.00** (0.00) | 0.01*** (0.00) |
| Female | −0.11** (0.04) | 0.02 (0.01) | −0.27*** (0.04) | −0.30*** (0.03) |
| Education | ||||
| High school | 0.36 (0.23) | 0.02 (0.06) | 0.50 (0.25) | 0.34* (0.14) |
| Some college | 0.43 (0.22) | 0.02 (0.06) | 0.61* (0.25) | 0.44** (0.14) |
| Bachelor’s | 0.48* (0.22) | 0.00 (0.06) | 0.77** (0.25) | 0.64*** (0.14) |
| Graduate/professional | 0.57* (0.22) | 0.03 (0.06) | 0.88*** (0.25) | 0.65*** (0.14) |
| Married | 0.04 (0.05) | 0.01 (0.01) | 0.04 (0.05) | −0.00 (0.03) |
| Income | 0.02* (0.01) | −0.00 (0.00) | 0.03*** (0.01) | 0.03*** (0.00) |
| Ethnicity/race | ||||
| Black, non-Hispanic | 0.27** (0.09) | 0.12*** (0.02) | 0.14 (0.11) | −0.43*** (0.06) |
| Other, non-Hispanic | −0.14 (0.09) | −0.03 (0.02) | −0.17 (0.10) | −0.01 (0.06) |
| Hispanic | 0.16 (0.09) | 0.10*** (0.02) | 0.05 (0.10) | −0.37*** (0.07) |
| Intercept | −0.46 (0.26) | −0.08 (0.07) | 3.91*** (0.29) | −0.80*** (0.15) |
| Observations | 2,000 | 1,997 | 2,000 | 2,012 |
| R2 | 0.04 | 0.05 | 0.09 | 0.24 |
NOTES.—Unstandardized coefficients. OC: overconfidence. The models are based on an investor subsample. The number of missing cases never exceeds 0.7%. Robust standard errors are in parentheses.
p < .001
p < .01
p < .05.
Separating Confidence and Knowledge
Columns (3) and (4) of table 5 examine the association between joint financial decision-making and confidence as well as latent knowledge (i.e., IRT-based theta scores) among actively investing consumers. In line with study 1, joint decision-making within close relational ties or a combination of personal and professional ties is associated with significantly lower levels of confidence compared to lone investors. There seems to be no detectable affiliation with those who only rely on professional financial advice.
On the other hand, the latter group shows significantly higher levels of financial literacy than their solely deciding peers. Greater latent knowledge can also be observed among those who seek input from personal contacts and financial advisors. This suggests that solutions and problem reformulation might play a more pronounced role in professional financial joint decision-making due to the assumed increasing effect of these two dimensions on objective knowledge. Meanwhile, the SUT can explain why friends and family members are able to calibrate confidence in one’s financial knowledge without affecting objective knowledge.
Causality Check
Lastly, the issue of a lack of causal inference for the cross-sectional consumer sample is addressed by applying the previously discussed nonparametric nearest neighbor matching function to estimate the average treatment effects of joint versus lone decision-making among active investors. Exact matches are required for gender and ethnicity/race due to their consistent empirical importance (table 5 and supplementary table 9). Age, educational attainment, marital status, and income are used for approximate similarity. Robust SEs are applied, and all variables are bias-adjusted for large sample sizes. Distant measures seem sufficiently normally distributed with a superior fit for the model using IRT overconfidence (supplementary panel 2). Both operationalizations deliver very similar results that support the causal claim made in study 1; receiving the treatment of joint decision-making significantly lowers financial overconfidence. Specifically, if measured by IRT overconfidence, lone investors exhibit a causally traceable increase in overconfidence in their financial knowledge by .20 SD (SE = .80, p = .010, 95% CI [.05; .35]). The robustness of this claim can be verified using the naive financial overconfidence measure. In this case, lone investors experience a 5.61% increase compared to joint financial decision-makers (SE = 1.69%, p < .001, 95% CI [2.29%; 8.92%]).
Following the approach to test the sensitivity of the semi-parametric matching model in study 1, a multivalued treatment effects model was fitted. Specifically, an augmented inverse propensity weighted estimation with a linear outcome model and a multinomial logistic treatment model using the same control variables, as outlined in table 5, and heteroskedasticity-robust SEs was applied (Glynn and Quinn 2010). Jointly deciding exclusively with household members reduces IRT overconfidence by .28 SD (SE = .07, p < .001, 95% CI [−.42; −.13]) compared to lone investors. Similarly, sharing financial decision-making with a professional advisor (Coef. = −.20 SD, SE = .08, p = .011, 95% CI [−.35; −.05]) or a combination of both (Coef. = −.23 SD, SE = .07, p = .001, 95% CI [−.36; −.09]) significantly decreases IRT overconfidence. Lone investors, on the other hand, can be causally linked to a higher level of financial overconfidence (Coef. = .41 SD, SE = .06, p < .001, 95% CI [.30; .53]). Using a more simplistic regression adjustment model yields practically identical results.
Discussion
Studies 1 and 2 establish a robust pattern of confounders for investor overconfidence. The findings suggest that joint decision-making, particularly within close ties, decreases investor overconfidence. This provides consistent empirical evidence in favor of hypotheses 1 and 2.
STUDY 3: FIVE DIMENSIONS OF JOINT FINANCIAL DECISION-MAKING
While the findings from the previous two studies consistently support hypotheses 1, 2, and 4, the nationally representative investor and consumer samples cannot shed light on the mechanism behind the diminishing effect of joint financial decision-making on investor overconfidence. The conceptual framework outlines how solutions, metaknowledge, problem reformulation, validation, and legitimation are assumed to influence investor overconfidence in this process. Study 3 experimentally tests these five dimensions by manipulating joint financial decision-making with each of the five dimensions based on Cross et al. (2001), using a between-subject design with five treatment groups and a within-subject design with pre- and post-manipulation measures. The study was preregistered prior to data collection.2 The pilot data, raw data, and instruments can be found in the preregistration.
Method
Participants
Data are drawn from a commercial panel (Precision Sample LLC) in December 2021. Participants were preselected to be US-based active investors (i.e., actively selecting securities for investment purposes) aged 18 years or older. Initially, 338 panelists provided informed consent, and 24 did not consent. Of these, 281 were exposed to the stimuli (mean age 44.83, 44% female, median education bachelor’s degree, 52% married, median income $70,000–$79,999, 74% self-identified as White/Caucasian, 8% as African American, and approximately 11% as Hispanic, 12% have traded on margin; supplementary table 10). They were randomly placed in one of the five experimental groups (N = 54, 57, 54 58, 58). On average, participants needed about 10 minutes to complete the survey.
Procedure
After consenting to the study and qualifying for participation, panelists were asked to answer 10 forced-choice investment quiz questions that a US investment bank (Schwab.com 2017 for a complete list) designed for their clients (e.g., Q: “Over the past 25 years, which investing method has consistently generated the worst returns for long-term investors?” A: “Investing a lump sum at market peaks”; “Investing a lump sum at market troughs”; “Staying in cash and not investing at all”) and indicate their confidence levels in the associated answers on sliders (“How confident are you that your answer is correct?”), ranging from 0 (“Not at all confident”) to 100 (“Extremely confident”). This setup was chosen to provide a pre–post comparison and to reduce demand artifacts.
Next, treated participants were randomly allocated to one of the five groups. All groups had to decide whether to invest in one of two actual total bond market exchange traded funds (ETFs). Specifically, participants were provided with the inception dates (with a layman’s term synonym), expense ratios, assets under management, 4 week return, and 3 year return for the iShares Core U.S. Aggregate Bond ETF (ETF1) and the Vanguard Total Bond Market ETF (ETF2). Both ETFs are sufficiently similar to mimic an investment under uncertainty (ETF Database 2020). Using much more volatile ETFs (Invesco DB Commodity Index Tracking Fund and United States Commodity Index Fund) showed no difference in experimental behavior among a comparable sample of 297 investors. ETF names were replaced with generic labels (i.e., ETF1/2) to prevent invoking strong preferences based on brand familiarity. All groups were reminded to “work with another participant […] to invest in one out of two possible total bond market exchange traded funds” before deciding whether to invest in ETF1 or 2.
After deciding, the five treatment groups saw an interactive typing bubble, timed at 6 seconds before receiving a chat message that was perceived to come from another participant. However, to ensure privacy for all participants and to preserve a high degree of experimental control, the response was a random draw based on group allocation. Panelists in the solution manipulation saw a message reading “I quickly crunched the numbers. ETF2 has the higher yield,” compared to “I feel like there’s not enough information. How about you?” for metaknowledge, “I took the other ETF. Why didn’t you choose the alternative?” for problem reformulation, “I can see where you’re coming from with your ETF choice” for validation, and “I actually work in finance and your ETF choice is correct” for legitimation. The five treatment groups were then asked to use a chat window to respond in 50 characters or more.
Next, all participants rated their interaction (“How helpful was the input/information in terms of … [line break omitted] coming up with a solution, appreciating what is unknown about the ETFs, considering the alternative, supporting your choice, legitimizing your choice”) on a 5-point Likert scale matrix, ranging from “Not at all helpful” to “Extremely helpful” for all five dimensions. The following block on subjective versus objective investment literacy is identical to that of the NFCS investor sample in study 1. Finally, demographics for margin trades (Q: “Have you made any securities purchases on margin?”), education, gender (male, female, non-binary), age (continuous), marital status (binary), ethnicity/race, and annual household income were surveyed.
Overconfidence Measures
IRT and naive overconfidence based on the 10 NFCS items were operationalized as described in study 1. Pre- and post-differences for knowledge, confidence, and overconfidence between the 10 Schwab and NFCS quiz questions were defined as the percentage of correct answers to the Schwab items (pre) minus the percentage of correctly answered NFCS items (post) for knowledge, average confidence (pre; in %) minus relative confidence (post; in %), and the difference between naive overconfidence measures for Schwab and NFCS. A paired sample two-tailed t-test for latent knowledge scores using a two-parameter IRT model for both Schwab and NFCS items shows that both batteries are comparable down to the third decimal place in terms of mean, SE, and 95% confidence interval (MSchwab = MNFCS = 0.000, SE = 0.038, 95% CI [−0.074; 0.075], p = .997, d = 0.00).
Pilot
In December 2021, 73 participants were recruited using Amazon Mechanical Turk (MTurk). There were five dropouts prior to the experimental group allocation, and four participants did not consent, leaving 64 usable responses. The average time to completion was approximately 11 minutes. Minor changes (e.g., error correction and revised wording for clarity) were made based on the results of the pilot.
Results
Differences in Confidence, Knowledge, and Overconfidence
Three of the five groups showed virtually no changes in objective financial knowledge pre- versus post-manipulation, suggesting that there was no learning effect (figure 2).
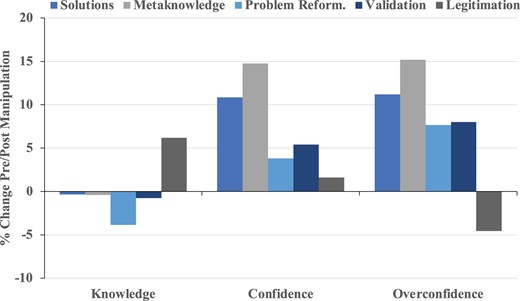
PERCENTAGE CHANGE BETWEEN PRE- AND POST-MANIPULATION MEASURES BY GROUP

Considering the alternative seems to have marginally increased financial knowledge among the problem reformulation group. This has been previously shown in lone decision-making experiments with trivia questions (Walters et al. 2017). Somewhat surprisingly, the legitimation group appears to have unlearned over the course of the study. More importantly, figure 1 reveals that decreasing overconfidence (shown here as a positive percentage change between pre and post) is driven by diminishing confidence, most notably in the metaknowledge group.
Table 6 column (1) supports this notion and shows that participants in the metaknowledge group significantly decreased their overconfidence levels, compared to their peers in the legitimation group. This result is backed up by paired sample t-tests using the within-subject design of the experiment. Only participants in the metaknowledge group significantly reduced their overconfidence levels over the course of the study (paired, two-tailed: MDiff = 15.17%, SE = 6.31%, p = .020, d = 0.32). All of these findings are in line with hypothesis 3. The remaining groups had no notable effect (paired, two-tailed: ps = .088, .201, .243, and .445, respectively). However, the significant causal relation between lower investor overconfidence and metaknowledge group allocation does not rule out other explanations. For instance, the wording of the perceived interaction may have triggered the observed response. The next subsection addresses this possibility.
Impact of Group allocation and SUT Interaction on Pre/Post-Differences
| Dependent variables | (1) | (2) |
|---|---|---|
| Pre/post-diff. (1) OC; (2) confidence | Five dimensions | SUT interaction |
| Solution | 8.36 (8.29) | 4.80 (2.75) |
| Metaknowledge | 19.21* (8.48) | 6.87* (2.90) |
| Problem reformulation | 6.65 (7.72) | 2.41 (2.55) |
| Validation | 9.13 (8.42) | 4.40 (2.72) |
| Legitimation | (baseline) | 2.46 (2.24) |
| Education | ||
| Some college but no degree | −8.67 (11.63) | −13.72 (10.39) |
| Associate degree in college | −16.84 (11.98) | −15.11 (10.69) |
| Bachelor's degree in college | −10.52 (10.66) | −10.38 (9.70) |
| Master's degree | 31.80* (15.45) | 17.01 (14.27) |
| Professional degree (JD, MD) | −37.78** (11.77) | −32.48** (10.23) |
| Female | −30.43*** (5.49) | −28.25*** (4.91) |
| Age | 0.08 (0.17) | 0.11 (0.16) |
| Marital status | 4.61 (5.90) | −0.59 (5.33) |
| Household income | −0.72 (1.00) | −0.22 (0.96) |
| Ethnic/racial affiliation | ||
| African American | 12.57 (10.35) | 9.11 (10.29) |
| Hispanic | 4.72 (8.90) | 2.42 (7.69) |
| Asian | 11.42 (15.40) | 6.30 (11.04) |
| Native American | 29.94*** (8.65) | 28.77** (9.25) |
| Other | −105.87*** (15.52) | −63.76*** (14.97) |
| Constant | 19.31 (15.83) | 14.46 (16.41) |
| Observations | 280 | 272 |
| R2 | 0.23 | 0.23 |
| Dependent variables | (1) | (2) |
|---|---|---|
| Pre/post-diff. (1) OC; (2) confidence | Five dimensions | SUT interaction |
| Solution | 8.36 (8.29) | 4.80 (2.75) |
| Metaknowledge | 19.21* (8.48) | 6.87* (2.90) |
| Problem reformulation | 6.65 (7.72) | 2.41 (2.55) |
| Validation | 9.13 (8.42) | 4.40 (2.72) |
| Legitimation | (baseline) | 2.46 (2.24) |
| Education | ||
| Some college but no degree | −8.67 (11.63) | −13.72 (10.39) |
| Associate degree in college | −16.84 (11.98) | −15.11 (10.69) |
| Bachelor's degree in college | −10.52 (10.66) | −10.38 (9.70) |
| Master's degree | 31.80* (15.45) | 17.01 (14.27) |
| Professional degree (JD, MD) | −37.78** (11.77) | −32.48** (10.23) |
| Female | −30.43*** (5.49) | −28.25*** (4.91) |
| Age | 0.08 (0.17) | 0.11 (0.16) |
| Marital status | 4.61 (5.90) | −0.59 (5.33) |
| Household income | −0.72 (1.00) | −0.22 (0.96) |
| Ethnic/racial affiliation | ||
| African American | 12.57 (10.35) | 9.11 (10.29) |
| Hispanic | 4.72 (8.90) | 2.42 (7.69) |
| Asian | 11.42 (15.40) | 6.30 (11.04) |
| Native American | 29.94*** (8.65) | 28.77** (9.25) |
| Other | −105.87*** (15.52) | −63.76*** (14.97) |
| Constant | 19.31 (15.83) | 14.46 (16.41) |
| Observations | 280 | 272 |
| R2 | 0.23 | 0.23 |
NOTES.—Unstandardized coefficients. Model (1) shows the impact of group allocation on the pre/post-difference in overconfidence (OC) relative to the legitimation group. Model (2) shows the interaction between self-assessed helpfulness to highlight unknowns (i.e., SUT) and group allocation on the pre/post-difference in confidence. One missing case is in (1) and nine in (2). Robust standard errors are in parentheses.
p < .001
p < .01
p < .05.
Impact of Group allocation and SUT Interaction on Pre/Post-Differences
| Dependent variables | (1) | (2) |
|---|---|---|
| Pre/post-diff. (1) OC; (2) confidence | Five dimensions | SUT interaction |
| Solution | 8.36 (8.29) | 4.80 (2.75) |
| Metaknowledge | 19.21* (8.48) | 6.87* (2.90) |
| Problem reformulation | 6.65 (7.72) | 2.41 (2.55) |
| Validation | 9.13 (8.42) | 4.40 (2.72) |
| Legitimation | (baseline) | 2.46 (2.24) |
| Education | ||
| Some college but no degree | −8.67 (11.63) | −13.72 (10.39) |
| Associate degree in college | −16.84 (11.98) | −15.11 (10.69) |
| Bachelor's degree in college | −10.52 (10.66) | −10.38 (9.70) |
| Master's degree | 31.80* (15.45) | 17.01 (14.27) |
| Professional degree (JD, MD) | −37.78** (11.77) | −32.48** (10.23) |
| Female | −30.43*** (5.49) | −28.25*** (4.91) |
| Age | 0.08 (0.17) | 0.11 (0.16) |
| Marital status | 4.61 (5.90) | −0.59 (5.33) |
| Household income | −0.72 (1.00) | −0.22 (0.96) |
| Ethnic/racial affiliation | ||
| African American | 12.57 (10.35) | 9.11 (10.29) |
| Hispanic | 4.72 (8.90) | 2.42 (7.69) |
| Asian | 11.42 (15.40) | 6.30 (11.04) |
| Native American | 29.94*** (8.65) | 28.77** (9.25) |
| Other | −105.87*** (15.52) | −63.76*** (14.97) |
| Constant | 19.31 (15.83) | 14.46 (16.41) |
| Observations | 280 | 272 |
| R2 | 0.23 | 0.23 |
| Dependent variables | (1) | (2) |
|---|---|---|
| Pre/post-diff. (1) OC; (2) confidence | Five dimensions | SUT interaction |
| Solution | 8.36 (8.29) | 4.80 (2.75) |
| Metaknowledge | 19.21* (8.48) | 6.87* (2.90) |
| Problem reformulation | 6.65 (7.72) | 2.41 (2.55) |
| Validation | 9.13 (8.42) | 4.40 (2.72) |
| Legitimation | (baseline) | 2.46 (2.24) |
| Education | ||
| Some college but no degree | −8.67 (11.63) | −13.72 (10.39) |
| Associate degree in college | −16.84 (11.98) | −15.11 (10.69) |
| Bachelor's degree in college | −10.52 (10.66) | −10.38 (9.70) |
| Master's degree | 31.80* (15.45) | 17.01 (14.27) |
| Professional degree (JD, MD) | −37.78** (11.77) | −32.48** (10.23) |
| Female | −30.43*** (5.49) | −28.25*** (4.91) |
| Age | 0.08 (0.17) | 0.11 (0.16) |
| Marital status | 4.61 (5.90) | −0.59 (5.33) |
| Household income | −0.72 (1.00) | −0.22 (0.96) |
| Ethnic/racial affiliation | ||
| African American | 12.57 (10.35) | 9.11 (10.29) |
| Hispanic | 4.72 (8.90) | 2.42 (7.69) |
| Asian | 11.42 (15.40) | 6.30 (11.04) |
| Native American | 29.94*** (8.65) | 28.77** (9.25) |
| Other | −105.87*** (15.52) | −63.76*** (14.97) |
| Constant | 19.31 (15.83) | 14.46 (16.41) |
| Observations | 280 | 272 |
| R2 | 0.23 | 0.23 |
NOTES.—Unstandardized coefficients. Model (1) shows the impact of group allocation on the pre/post-difference in overconfidence (OC) relative to the legitimation group. Model (2) shows the interaction between self-assessed helpfulness to highlight unknowns (i.e., SUT) and group allocation on the pre/post-difference in confidence. One missing case is in (1) and nine in (2). Robust standard errors are in parentheses.
p < .001
p < .01
p < .05.
The Salience of the Unknown Theory and Group Allocation
The theoretical framework argues that metaknowledge drives the decrease in investor overconfidence among joint decision-makers by highlighting unknown aspects of a decision under uncertainty, which, in turn, decreases confidence in an investor’s knowledge. To determine whether this holds, all experimental participants were asked to rate their interaction on the five dimensions after chatting with the “other participant.” Importantly, they indicated how helpful the interaction was to appreciate “what is unknown about the ETFs.” Column (2) in table 6 shows that only participants in the randomly allocated metaknowledge group who rated their interaction as being helpful in highlighting unknowns significantly decreased confidence in their investment knowledge over the course of the experiment. This provides further evidence in favor of hypothesis 3 and supports the SUT. Furthermore, it should be noted that the results for the differences in overconfidence and confidence are remarkably consistent across the two OLS models.
Financial Consequences of Investor Overconfidence
Using the proposed Schwab overconfidence measure, study 3 supports the previous finding that overconfident investors have significantly higher odds of investing on margin (hypothesis 4), seemingly independent of the underlying operationalization of the bias (supplementary table 11).
Discussion
Study 3 illustrates the impact of metaknowledge on investor overconfidence in joint financial decision-making. Randomly allocating investors to chat with someone who makes unknown aspects of a financial decision more salient helps participants to significantly reduce their investor overconfidence. This effect appears to be driven by the SUT and its impact on consumers’ subjective financial knowledge (hypothesis 3). None of the other four dimensions of joint financial decision-making had any notable effect on confidence or overconfidence. In fact, while figure 2 suggests that presenting a person with solutions may have an equally diminishing impact on overconfidence, after controlling for demographics, the coefficient for the solution group is no different than that of other experimental groups. Similarly, the within-subject design confirms that only metaknowledge significantly decreases investor overconfidence over the duration of the study. However, the presented experiment is a simplification of actual joint financial decision-making in a highly controlled environment. For instance, the design did not allow participants in the solution group to ask clarifying questions which may have allowed them to increase their objective knowledge. Furthermore, the length of exposure may have been insufficient for the validation group to feel emotionally supported. Aside from these idiosyncratic limitations, study 3 underlines the finding that overconfident investors exhibit greater odds of trading on margin (hypothesis 4).
STUDY 4: SALIENCE OF THE UNKNOWN
The second experiment tests the direct effect of joint decision-making in a randomized controlled trial. It also aims to cross-validate the indirect effect of the SUT and explores the impact of different wordings for the manipulations, length of exposure, and performance incentives on the reported results. The SUT was tested by randomly allocating participants to scenarios in which they were asked to reflect on unknown aspects of an investment (metaknowledge), alternatives to said investment (problem reformulation), or the survey itself (control group) in a between-subject design. The study, its pilot, instruments, and data are available in the preregistration that have been filed prior to data collection.3
Method
Participants
Participants were recruited on MTurk in October 2020. Workers received at least $0.85 for participation. Thirty participants were randomly selected to receive an additional $0.1 per correct answer to any of the 20 financial quiz questions. Performance incentives increased payments by up to 235%. MTurkers were preselected to reside in the United States, had a historic approval rating of more than 98%, and had not participated in any previous study. Initially, 379 investors (60% of total completes) took part in the study. Three bots were detected, as they were unable to visually differentiate a banana from an apple or tomato. This leaves 376 valid investor responses (mean age 40, 36% female, 75% held at least a bachelor’s degree, 60% married, median income $60,000–$69,999, 70% self-identified as White/Caucasian, 12% as African American, and 8% as Asian, supplementary table 12). On average, participants needed 10 minutes to complete the study.
Procedure
The experimental design was based on study 3. However, there are a few notable exceptions. First, the experiment included a control group that was asked to select one of the two ETFs without the input of others (i.e., lone financial decision-makers). Controls were overrecruited (200 controls, 87 metaknowledge, and 89 problem reformulation) to form a reliable baseline for OLS regressions. Second, all participants were reminded that randomly selected workers would receive $0.1 per correct response prior to each of the two investment quizzes.
Third, the sensitivity to the specific wording of the manipulation in study 3 was tested by altering the prompts. Participants in the problem reformulation group saw the following chat message: “I took the other ETF. Why didn’t you choose the alternative?” The metaknowledge group had to respond to “I took the other ETF. What’s unknown about the two options?” Lastly, controls were prompted to describe their user experience (Q: “How would you describe your user experience with this survey?”). Fourth, the sensitivity to the length of exposure was tested by increasing the character count from 50 to 80. Finally, bot traps (reCAPTCHA v3 and visual identification of a banana) were introduced to retain a sufficiently high data quality.
Overconfidence Measures
Measures were defined as described in studies 1–3.
Pilot
The experimental design was tested using a convenience sample of 50 business school students at the University of Sussex Business School in October 2020. In total, 16 students completed the survey (see preregistration); on average, 13 minutes were required to complete the task. Minor changes were made to the phrasing of the stimuli and the location of the question blocks.
Results
Causal Differences in Investor Overconfidence
First, the between-subject design was used to test whether joint financial decision-making causally reduced overconfidence, compared to the control group. Table 7 reports the results of a regression using OLS and bootstrapped SEs. Randomly placing participants in a joint financial decision-making situation in which unknowns are highlighted causally decreases investor overconfidence, compared to their solely deciding peers (hypotheses 1 and 3). Problem reformulation, however, had no traceable effect on overconfidence after being exposed to the stimulus. These findings are in accordance with the results of studies 1–3. The decreasing effect of metaknowledge over the course of the study is further supported by a two-tailed paired t-test (MDiff = 38.48%, SE = 3.69%, p < .001, d = 1.04), using the within-subject design of the pre/post-differences in overconfidence (hypothesis 3).
Causal Differences In Overconfidence Between Groups
| IRT overconfidence | |
|---|---|
| Metaknowledge | −0.20* (0.10) |
| Problem reformulation | 0.12 (0.11) |
| Female | 0.37*** (0.08) |
| Age | −0.00 (0.00) |
| Marital status | −0.29*** (0.09) |
| Bachelor+ | −0.42*** (0.10) |
| Household income | |
| $10,000–$19,999 | 0.42 (0.25) |
| $20,000–$29,999 | 0.50* (0.23) |
| $30,000–$39,999 | 0.57* (0.24) |
| $40,000–$49,999 | 0.59** (0.19) |
| $50,000–$59,999 | 0.31 (0.21) |
| $60,000–$69,999 | 0.29 (0.20) |
| $70,000–$79,999 | 0.59** (0.21) |
| $80,000–$89,999 | 0.49 (0.26) |
| $90,000–$99,999 | 0.78** (0.24) |
| $100,000–$149,999 | 0.75*** (0.22) |
| More than $150,000 | 0.31 (0.24) |
| Ethnic/racial affiliation | |
| African American | −0.38* (0.15) |
| Hispanic | 0.06 (0.19) |
| Asian | 0.29 (0.15) |
| Native American | −0.31 (0.30) |
| Pacific Islander | 0.33 (0.19) |
| Other | 0.43 (0.42) |
| Constant | −0.49* (0.23) |
| Observations | 376 |
| R2 | 0.21 |
| IRT overconfidence | |
|---|---|
| Metaknowledge | −0.20* (0.10) |
| Problem reformulation | 0.12 (0.11) |
| Female | 0.37*** (0.08) |
| Age | −0.00 (0.00) |
| Marital status | −0.29*** (0.09) |
| Bachelor+ | −0.42*** (0.10) |
| Household income | |
| $10,000–$19,999 | 0.42 (0.25) |
| $20,000–$29,999 | 0.50* (0.23) |
| $30,000–$39,999 | 0.57* (0.24) |
| $40,000–$49,999 | 0.59** (0.19) |
| $50,000–$59,999 | 0.31 (0.21) |
| $60,000–$69,999 | 0.29 (0.20) |
| $70,000–$79,999 | 0.59** (0.21) |
| $80,000–$89,999 | 0.49 (0.26) |
| $90,000–$99,999 | 0.78** (0.24) |
| $100,000–$149,999 | 0.75*** (0.22) |
| More than $150,000 | 0.31 (0.24) |
| Ethnic/racial affiliation | |
| African American | −0.38* (0.15) |
| Hispanic | 0.06 (0.19) |
| Asian | 0.29 (0.15) |
| Native American | −0.31 (0.30) |
| Pacific Islander | 0.33 (0.19) |
| Other | 0.43 (0.42) |
| Constant | −0.49* (0.23) |
| Observations | 376 |
| R2 | 0.21 |
NOTES.—Unstandardized coefficients. Controls were used as baseline. Bootstrapped standard errors with 250 replications and a random seed of 12,345 are in parentheses to account for unequal group sizes. IRT overconfidence standardized (study 1). No missing cases.
p < .001
p < .01
p < .05.
Causal Differences In Overconfidence Between Groups
| IRT overconfidence | |
|---|---|
| Metaknowledge | −0.20* (0.10) |
| Problem reformulation | 0.12 (0.11) |
| Female | 0.37*** (0.08) |
| Age | −0.00 (0.00) |
| Marital status | −0.29*** (0.09) |
| Bachelor+ | −0.42*** (0.10) |
| Household income | |
| $10,000–$19,999 | 0.42 (0.25) |
| $20,000–$29,999 | 0.50* (0.23) |
| $30,000–$39,999 | 0.57* (0.24) |
| $40,000–$49,999 | 0.59** (0.19) |
| $50,000–$59,999 | 0.31 (0.21) |
| $60,000–$69,999 | 0.29 (0.20) |
| $70,000–$79,999 | 0.59** (0.21) |
| $80,000–$89,999 | 0.49 (0.26) |
| $90,000–$99,999 | 0.78** (0.24) |
| $100,000–$149,999 | 0.75*** (0.22) |
| More than $150,000 | 0.31 (0.24) |
| Ethnic/racial affiliation | |
| African American | −0.38* (0.15) |
| Hispanic | 0.06 (0.19) |
| Asian | 0.29 (0.15) |
| Native American | −0.31 (0.30) |
| Pacific Islander | 0.33 (0.19) |
| Other | 0.43 (0.42) |
| Constant | −0.49* (0.23) |
| Observations | 376 |
| R2 | 0.21 |
| IRT overconfidence | |
|---|---|
| Metaknowledge | −0.20* (0.10) |
| Problem reformulation | 0.12 (0.11) |
| Female | 0.37*** (0.08) |
| Age | −0.00 (0.00) |
| Marital status | −0.29*** (0.09) |
| Bachelor+ | −0.42*** (0.10) |
| Household income | |
| $10,000–$19,999 | 0.42 (0.25) |
| $20,000–$29,999 | 0.50* (0.23) |
| $30,000–$39,999 | 0.57* (0.24) |
| $40,000–$49,999 | 0.59** (0.19) |
| $50,000–$59,999 | 0.31 (0.21) |
| $60,000–$69,999 | 0.29 (0.20) |
| $70,000–$79,999 | 0.59** (0.21) |
| $80,000–$89,999 | 0.49 (0.26) |
| $90,000–$99,999 | 0.78** (0.24) |
| $100,000–$149,999 | 0.75*** (0.22) |
| More than $150,000 | 0.31 (0.24) |
| Ethnic/racial affiliation | |
| African American | −0.38* (0.15) |
| Hispanic | 0.06 (0.19) |
| Asian | 0.29 (0.15) |
| Native American | −0.31 (0.30) |
| Pacific Islander | 0.33 (0.19) |
| Other | 0.43 (0.42) |
| Constant | −0.49* (0.23) |
| Observations | 376 |
| R2 | 0.21 |
NOTES.—Unstandardized coefficients. Controls were used as baseline. Bootstrapped standard errors with 250 replications and a random seed of 12,345 are in parentheses to account for unequal group sizes. IRT overconfidence standardized (study 1). No missing cases.
p < .001
p < .01
p < .05.
Financial Consequences of Investor Overconfidence
The results from study 4 further support the notion that overconfident investors exhibit greater odds of trading on margin (column (2) in supplementary table 11).
Discussion
All the findings from study 4 are in accordance with prior results. Performance incentives, length of exposure to the stimuli, differences in the sampled population, and changes in the wordings of the manipulation did not change the hypothesized diminishing effect of metaknowledge on investor overconfidence (hypothesis 3). Furthermore, the randomized controlled trial supports the causal inferences made in studies 1 and 2; joint financial decision-making decreases investor overconfidence if metaknowledge is shared (hypothesis 1). This study presents consistent evidence that the process is driven by the SUT. Next, the combined findings are discussed.
GENERAL DISCUSSION
Prior research commonly treats consumer financial decision-making as a case of individual choice (Ward and Lynch 2019). Little is known about the influence of joint financial decision-making on this process. For instance, would consumers benefit from the wisdom of others by debiasing their judgments? Does it matter whom they ask or in which relationship the parties stand to each other? This study contributes to the consumer behavior literature by assessing the impact of joint financial decision-making on investor overconfidence. A series of regression analyses show that jointly deciding with others causally decreases overconfidence (hypothesis 1). It is also shown that only interacting within close relational ties, such as family and friends, has a greater diminishing effect than relying solely on professional financial advice (hypothesis 2). The presented results can explain this discrepancy by shedding light on the nature and process of joint decisions. Getting input from others does not increase objective financial knowledge (studies 1 and 2). Instead, joint decision-making seems to have a profound impact on subjective financial knowledge (studies 1–4).
The current research compares the impact of five dimensions of joint financial decision-making on overconfidence and finds that metaknowledge drives the reduction (hypothesis 3). By making unknown aspects of a financial decision more salient, others can share their metaknowledge and put the decision-maker’s investment knowledge into perspective (studies 3 and 4). The combined results suggest that the nature of joint financial decision-making is not one of increasing objective knowledge but rather a metaknowledge-generating process. Lastly, this research reaffirms why calibration is an important aspect of consumer financial well-being. Studies 1, 3, and 4 show that investor overconfidence significantly increases the odds of margin trading. This is a risky financial instrument that is most suitable for institutional investors or other highly sophisticated financial actors and not private investors who have an inflated perception of their financial knowledge (Santa-Clara and Saretto 2009).
Thus, the current research offers several practical implications that may help consumers improve the quality of their investment decisions. Those with significant financial responsibilities (e.g., household bookkeepers and treasurers in small communities) should not be selected based on expressed confidence in their financial knowledge. Even though consumers cannot directly observe objective knowledge, studies 1 and 2 show that among lone decision-makers, confidence is a particularly poor proxy for one’s actual financial knowledge. Instead, personal profiles for these roles should carefully consider the need for a cooperative mindset. The findings show that including trusted individuals in a financial decision-making process calibrates a person’s confidence and may make them less susceptible to engaging in risky financial behaviors (Merkle 2017; Odean 2002). Notably, this calibrating effect does not depend on the other side’s financial knowledge. In fact, studies 3 and 4 show that highlighting unknown aspects of a decision has the most significant impact on a consumer’s overconfidence level.
There are also practical implications for the financial service sector. Studies 1 and 2 show that financial advisors are less effective in reducing their clients’ overconfidence levels compared to family members and friends (hypothesis 2). However, there is some evidence that combining personal and professional interactions has a profoundly calibrating effect (study 1). Consequently, instead of monopolizing financial advice, financial counselors should actively encourage intrahousehold joint financial decision-making. For instance, professional advisors can hold couple sessions to facilitate money talks. Furthermore, institutions should foster metaknowledge during their onboarding process. For example, robo-advisors already include a list of questions that elicit risk preferences, investment goals, and financial expertise (Jung et al. 2018). The current research shows that adding reflective statements that make unknown aspects of an investment more salient can decrease an investor’s overconfidence. In addition, studies 3 and 4 illustrate that perceived interactions are sufficient to significantly calibrate investors. Therefore, the SUT could also be used by chatbots in mobile banking applications or other Internet-based services to improve the quality of financial decision-making among consumers.
This study assesses the impact of joint financial decision-making and metaknowledge on investor overconfidence. Yet, future research could explore interactive decision-making and the SUT in the context of managerial overconfidence, expert judgments, and overconfidence in medical advice, to name only a few. Future experiments may also explore how the spectrum of joint versus lone decision-making influences the described process. Furthermore, the type of cooperation could influence the illustrated effect. Future studies should explore whether personal versus professional interactions moderate the mediating influence of metaknowledge. Lastly, additional research is needed to define a set of variables that drives the willingness to talk to others about financial matters. This may include interpersonal attachment, trust, a person’s long-term financial perspective, and the general availability of perceivably helpful advice.
Most financial decisions are made in tandem with others. The study demonstrates the profound impact that others can have on overconfidence. This shows that objective knowledge is peripheral in this process. Instead, metaknowledge, which helps to highlight unknowns, is the driving force behind the reported reduction in overconfidence among joint decision-makers.
DATA COLLECTION INFORMATION
The author solely collected and analyzed the data in this article. Study 1 uses publicly available data from the US Financial Industry Regulatory Authority’s (FINRA) 2015 National Financial Capability Study (NFCS), which were published in 2016. Study 2 utilizes data from the US Consumer Financial Protection Bureau’s (CFPB) Financial Well-being Survey, which were published in 2017. Study 3 is an online experiment using a commercial panel from Precision Sample LLC. Data were collected in December 2021. Study 4 is an online experiment using MTurk workers, which was conducted in October 2020. Data from studies 1 and 2 are publicly available from the data providers. Primary data for studies 3 and 4 are freely accessible on the Open Science Framework at https://osf.io/bca9k and https://osf.io/kth6x, respectively.
Footnotes
The 10-item short version is based on an unpublished paper (CFPB 2017, 32).
Author notes
Dominik M. Piehlmaier (d.m.piehlmaier@sussex.ac.uk) is a lecturer in marketing at the University of Sussex Business School, Brighton, UK.
The author would like to thank Darren Dahl, Dee Warmath, Lydia Ashton, and Janean Dilworth-Bart for their valuable feedback. The author also thanks Andrea Plassman for proofreading a previous version of this article. The author acknowledges the helpful input of the editors and the review team. The article is based on the author’s dissertation at the University of Wisconsin-Madison. Supplementary materials and analyses are included in the web appendix accompanying the online version of this article.