 https://orcid.org/0000-0002-2952-7020
Abstract
The replacement of turf lawns with water-wise landscaping has become a common tactic for water conservation in drought-prone cities and is often incentivized through rebate programs that subsidize the cost of turf conversion. The impact of rebate programs increases if neighbors are inspired to adopt water-wise landscaping independently. However, turf conversion is expensive even with a rebate, and residents may have non-financial reasons for maintaining lawns or installing water-wise landscaping independently. We explored the distribution of water-wise yards and rebate recipients in relation to sociodemographic and biophysical landscape characteristics across the city of Sacramento, California, USA. For 100 census tracts in Sacramento, we visually assessed the landscaping in front of every single-family home to classify it as water-wise or conventional. We found that ∼10% of 109,062 sampled yards were water-wise, while only 0.3% were rebate recipients. We also found that water-wise yards were clustered, suggesting a neighborhood adoption effect. Water-wise yards and rebate recipients were positively correlated with educational attainment, white population, income, and tree canopy, and negatively correlated with July temperature and households with children. Our research shows that most water-wise landscaping in Sacramento has been installed without rebates, in areas with greater shading and socioeconomic status. Rebates did not appear to offset barriers to turf conversion, but may inspire neighborhood adoption. Our findings suggest that while water-wise landscaping is becoming more prevalent, it is not accessible or desirable for all residents, potentially contributing to uneven distributions of urban water use and ecosystem services.
Introduction
Cities in water-limited regions are increasingly obliged to reduce their demand for water. In California, where water security is a major concern (Lund and Medellín-Azuara 2018), residential water use comprises more than 60% of total urban water consumption (Heberger, Cooley, and Gleick 2014), and in many cases, more than half of that water is used outdoors (Hanak and Davis 2006; Mini, Hogue, and Pincetl 2014a). Improving the efficiency of residential water use has been identified as the strategy with the greatest potential for reducing urban water use in California (Heberger, Cooley, and Gleick 2014), and a common tactic for achieving that aim is to replace water-intensive turf lawns with water-efficient or “water-wise” landscaping—drought-tolerant, low-water-use vegetation and alternative ground covers like mulch (Bijoor 2021; Hartin, Surls, and Bush 2022). Because the water and maintenance savings associated with water-wise landscaping can offset the costs of installation over time, turf replacement has the potential to be a cost-effective measure to address water scarcity; however, the up-front costs can be high (Jessup, DeShazo, and Panjwani 2016; Cooley, Phurisamban, and Gleick 2019). In addition to financial considerations, factors such as personal preference, biophysical constraints, and community norms can also influence residents’ desire and ability to implement a landscape change (Larson and Brumand 2014). Here, we map the occurrence of water-wise landscaping for single-family homes across a drought-prone city in California to understand the prevalence and spatial distribution of these interventions relative to sociodemographic and biophysical factors. A better understanding of patterns in residential landscaping can provide valuable insights for urban water management strategies.
Residents choose to replace their lawns with water-efficient landscaping for various reasons (Hartin, Surls, and Bush 2022). These reasons include aesthetic preference (Hayden et al. 2015), ease of maintenance (Martin, Peterson, and Stabler 2003), environmental concern (Larson et al. 2009), or because it fits in with the look of the neighborhood (Blaine et al. 2012). Conversely, people may choose to maintain turfgrass for many of the same reasons people choose to replace their lawns. Some residents prefer the aesthetic of neat, orderly lawns (Peterson et al. 2012), find grass easier to maintain (Larson et al. 2009), or simply choose to retain the yard design present when they moved in (Larsen and Harlan 2006). Functional priorities, such as providing a place to gather or for children to play, can also influence yard design choices (Yabiku, Casagrande, and Farley-Metzger 2008).
In arid and semi-arid climates, high summer temperatures may encourage residents to opt for the cooling “oasis” that turfgrass and shade trees offer (Stabler, Martin, and Brazel 2005; Larson et al. 2009). Turf and trees both contribute to reducing summer temperatures in cities (Shashua-Bar et al. 2011; Dialesandro, Wheeler, and Abunnasr 2019), but trees have a greater impact on thermal comfort due to their shading effect (Shashua-Bar et al. 2011). Thus, residents in areas with greater tree canopy cover may be more willing to choose water-efficient landscaping. Tree canopy cover, as well as overall vegetation abundance and diversity, are often related to the age of development in neighborhoods (Lowry, Baker, and Ramsey 2012), and neighborhoods of different ages also follow different development trends (Cook, Hall, and Larson 2012). Differences in both vegetation cover and urban structure across cities contribute to substantial intra-city temperature variation (Buyantuyev and Wu 2010; Dialesandro, Wheeler, and Abunnasr 2019), potentially leading to different landscaping choices for residents in neighborhoods with different heat regimes.
Additionally, individual landscaping choices may be influenced by neighborhood and cultural context (Cook, Hall, and Larson 2012). Residents’ yard design preferences tend to conform to community norms, and have even been shown to reverse depending on the design of nearby neighbors’ yards (Nassauer, Wang and Dayrell 2009). Whether it be in favor of turfgrass or water-wise landscapes, homeowners frequently manage their yards to uphold the ecological identity of the neighborhood (Grove, Locke, and O'Neil-Dunne 2014). Cultural norms and landscape preferences may relate to the race and ethnicity of residents (Virden and Walker 1999; Peterson et al. 2012), and understanding how landscape patterns map to different populations can also highlight issues of environmental justice (Peterson et al. 2012; Schwarz et al. 2015).
In practice, residential landscapes often differ from the preferences of their inhabitants, as homeowners and other residents navigate tradeoffs related to outdoor landscaping choices (Larson and Brumand 2014; Wheeler, Larson, and Andrade 2020). For example, vegetation choice can be constrained by property size or by the configuration of existing trees, specimen plants, or built elements, which may reflect development trends at the time when the property was built (Cook, Hall, and Larson 2012). In addition, access to resources such as time, money, and knowledge may limit a resident’s ability to realize or maintain their landscape preferences (Larsen and Harlan 2006). In this way, household income and educational attainment could affect landscaping design and choices. Regulatory pressures and other rules, such as homeowner or community association requirements, may further restrict a resident’s ability to maintain their preferred landscape (Martin, Peterson, and Stabler 2003; Cook, Hall, and Larson 2012). Rental properties face additional constraints on decision making that affects outdoor water use (Barnett, Jackson-Smith, and Endter-Wada 2019): tenants may have little control over major landscaping decisions and are less likely to see financial benefits from long-term conservation investments, while landlords often rely on landscapers or tenants for ongoing maintenance. Residential landscapes reflect what homeowners and other residents perceive to provide the best balance among aesthetic preferences, functional priorities, maintenance costs, and environmental values while operating within the bounds of their physical setting, social setting, and available resources.
Financial resources can be a barrier to turf replacement, as the up-front cost can be more than $50 per square meter of healthy lawn converted to water-efficient landscaping (Jessup, DeShazo, and Panjwani 2016; Cooley, Phurisamban, and Gleick 2019). To help residents overcome this cost barrier, many municipal governments and water utilities offer turf replacement incentive programs. These programs typically take the form of monetary rebates that pay a certain amount per square foot of converted turf, often with a cap for a single property, and some of these programs also include resources like design assistance or requirements like the inclusion of plants from an approved list (MacSwain et al. 2013). The scope of rebate programs varies considerably. For instance, the Metropolitan Water District of Southern California provided 46,000 rebates to replace more than 15 million m2 of turf between 2014 and 2015 alone (Pincetl et al. 2019), while the East Bay Municipal Utility District in Northern California provided around 700 rebates to replace nearly 70 thousand m2 of turf between 2009 and 2015 (Lassiter 2022). Rebate program participation can also be unevenly distributed across service areas. An examination of nearly 25,000 rebate program participants across Los Angeles County found that factors such as median income and home ownership influenced participation rates, and that participation was highly clustered in some parts of the county (Pincetl et al. 2019).
Rebate programs do not account for all water-wise landscaping in cities, as many residents install these landscapes independently. Most incentive programs are not as robust as the one in Southern California, and even where incentive funding is available, some residents may not qualify or know about it, or they may prefer to avoid program stipulations and paperwork. Recognizing these limitations, one of the identified potential benefits of turf replacement rebate programs is to showcase water-efficient yards that may inspire nearby residents to convert their yards independently (Pincetl et al. 2019). Understanding the extent and distribution of independently installed water-efficient landscaping would improve our ability to assess the impact of residential landscape change on water conservation at the neighborhood and city scales, as well as identify factors associated with this type of landscape change.
Our study seeks to answer the following questions: 1) What proportion of single-family homes (SFHs) in a drought-prone city maintain water-wise landscaping, and what proportion of those are participants in a municipal rebate program? 2) Are water-wise landscapes spatially clustered, and does municipal rebate program participation influence that clustering pattern? 3) How does the proportion of homes maintaining water-wise landscaping and participating in the rebate program vary in relation to the sociodemographic characteristics of the population and the physical landscape? We evaluate these questions in the city of Sacramento, California, which experiences very dry, hot summers and increasingly severe droughts. We focus on SFHs to capture the landscaping decisions of individual residents. We look at patterns of water-wise yards in relation to sociodemographic characteristics to provide insight into the populations that typically adopt water-wise landscaping in Sacramento. Understanding how populations, biophysical landscapes, and municipal programs interact to influence the distribution of water-wise landscapes can help inform strategies to improve water use efficiency in cities adapting to a future of increased water scarcity.
Methods
Study area
The city of Sacramento, which is located in the Central Valley of California, United States, has a population of ∼500,000 people and occupies 260 km2. Residential parcels occupy ∼37% of the land and are almost 90% of all parcels in the city. The vast majority (> 90%) of residential parcels are single-family homes (https://data-sacramentocounty.opendata.arcgis.com/). Sacramento residences did not historically have water meters, and water pricing at the time of this study was determined as a flat rate based on the size of the home. The City of Sacramento began installing water meters in 2005 to meet state requirements and completed the process in 2022.
Sacramento has a Mediterranean climate, with hot, dry summers and cool, wet winters. Precipitation falls predominantly between October and April, and in many years, the area receives no rain during the summer months. Annual precipitation is highly variable, with a mean since 1941 of 43.8 cm. Since 1941, the mean minimum temperature in January is 3.2°C and the mean maximum temperature in July is 33.7°C (WRCC 2021).
The State of California and City of Sacramento officially declared drought conditions in January of 2014, and the City enacted a mandate to reduce water use by 20%. Without meters to track water usage by property, the City relied on enforcement of its existing water conservation ordinance, which limited the days and times allowable for sprinkler irrigation. This ordinance has remained in effect, allowing sprinkler irrigation one day per week in the winter and two days per week in the summer, from 10 pm-7am only. Drip irrigation, hand watering, validated smart irrigation controllers, and certain landscape elements are exempt from these restrictions. In early summer of 2014, the City also began offering a turf replacement rebate program, open to property owners of single-family homes or bill-paying tenants with written permission. While the specifics of the program have changed somewhat over time, SFH participants have typically received $1.00–1.50 per square foot of turf replaced, capped at $3,000 per property. Rebates are available on a first come, first served basis, but the program has not needed to turn away applicants due to lack of funding (W. Granger, personal communication, Dec 12, 2022). To qualify for a rebate, newly installed landscapes must meet specific requirements, such as a predicted plant coverage of at least 50% at maturity (which was increased to 60% in 2019), at least five pre-approved drought-tolerant plants, and a drip irrigation system with a smart controller if irrigation is installed. Each residence must also undergo a pre- and post-inspection before receiving the rebate. This “cash for grass” rebate is one of several water conservation strategies offered by the City of Sacramento and partnering agencies, which include free home water efficiency assessments, infrastructure and appliance rebates, and educational resources.
Study design and parcel evaluation
To determine the number and distribution of water-wise yards in front of single-family homes (SFH) across the city of Sacramento, we first generated a map of all SFHs in the city by removing multi-unit housing (i.e. apartment buildings and multiplexes) from city parcel data of residential housing. We limited our sampling to census tracts within the city boundary containing at least 100 SFHs (Fig. 1). Census tracts include populations between 1,000–8,000 people, with an optimum size of 4,000 people (www.census.gov).
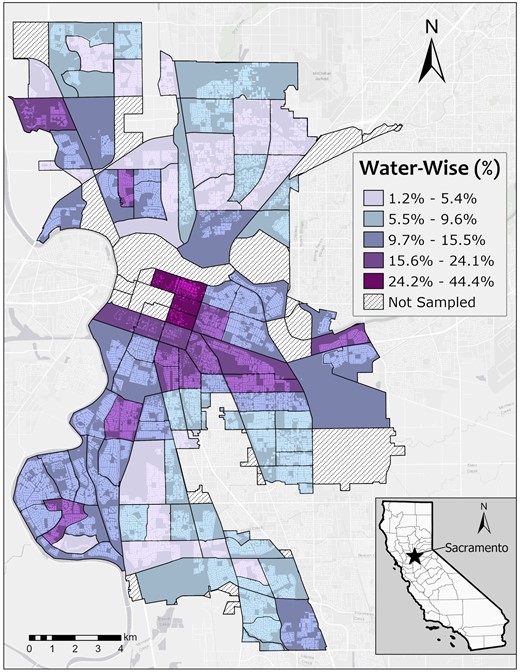
Percent water-wise yards in census tracts sampled in Sacramento, California. The Jenks optimization method in ArcGIS (ESRI) was used for data visualization. Single-family home parcel boundaries are indicated by the lighter colored area within each census tract boundary.

Within each of the identified census tracts, we drove, cycled, or walked by all accessible parcels containing SFHs, using the ArcGIS Collector application (ESRI) to identify parcels. We visually assessed the landscape cover in each front yard, extending from the façade of the house to the street, excluding driveway(s) and sidewalks. The planting strip in front of the house between the street and the sidewalk was also considered part of the parcel. We evaluated front yards for this study because they are publicly visible, allowing assessment across the majority of the city. Furthermore, front yards are more likely to be seen by neighbors and influence their landscaping choices. Each parcel was given a classification (see below), which was recorded in Collector to create a spatially explicit GIS layer of yard types. Single-family homes in gated communities were inaccessible and therefore not included, but represented <3% of the total SFHs in our parcel layer. Sampling was carried out during the summers of 2017 and 2018.
We classified the front yards of SFHs into three categories: “conventional,” “water-wise,” or “in progress.” Front yards with >67% turfgrass were classified as conventional. The remaining portions of these yards were frequently occupied by walkways and annual and perennial plantings along foundations and property boundaries, and other hardscaped areas. Parcels with <67% turfgrass cover were also considered conventional if turf was present and the remaining portion of the yard was either bare or planted with traditional groundcovers like ivy, or if non-turf plantings were in traditional locations like property boundaries, planter boxes, or adjacent to walkways. In addition, we classified parcels as conventional if no turf was present, but the yard did not reflect a contemporary transformation to water-wise landscaping. A few scenarios typically led to this classification of conventional with no turf: very small yards with a tree or several shrubs occupying the entire space as the original landscape design; parcels where ivy or bushes were planted in lieu of grass due to topography; and parcels where the yard was sparsely vegetated or unvegetated due to uses such as play areas or parking.
Front yards with at least 33% water-efficient landscaping were classified as water-wise. Converted areas predominantly featured native or drought-tolerant vegetation watered by drip irrigation systems, and common groundcovers included woodchip mulch and rock. We included artificial turf as a water-wise groundcover, although the City’s rebate program does not. We further classified each water-wise yard as being fully water-wise if the entire front yard was converted to water-efficient landscaping, or partially water-wise if it retained some conventional landscaping, as described above.
Parcels with at least 33% groundcover that appeared to be in the process of landscape conversion were classified as being in progress. These yards had bare ground that appeared to be recently scraped or tilled, accompanied by other evidence of yard work (e.g. landscaping tools, flags, plastic cover, piles of gravel, yard signs, etc). Parcels that could not be assigned to any of the three categories were classified as “other.”
Rebate program participants and spatial clustering of water-wise yards
To relate the overall distribution of water-wise yards to that of participants in the turf replacement rebate program, we acquired a list from the City of Sacramento that included all turf replacement rebate program participants through December of 2018. The list included a total of 357 participants, with the earliest date in July of 2014. Of these 357 participants, 334 were included in our SFH layer and used for analysis.
We evaluated whether water-wise yards tended to be spatially clustered around rebate program participants, and whether water-wise yards tended to cluster together. For this analysis, we considered only participants in the rebate program who began their projects prior to 2017, because later participants may not have had time to influence neighboring parcels by the time of our sampling. We also limited our analysis to participants with confirmed water-wise front yards from our sampling, and to properties with two adjacent SFH parcels on either side of their address and five across the street. These parcels were selected because they would likely have the strongest influence on neighbors due to their proximity. Out of the 334 rebate participants in our SFH layer, 210 met our criteria. For each of these 210 properties, we used our map of yard type classifications in ArcGIS (ESRI) to evaluate how many of the nine closest SFH parcels had water-wise front yards. To compare the neighborhood effect of rebate program participation to a baseline of conventional yards and to independent water-wise yards using a balanced statistical approach, we carried out the same evaluation on a random selection of 210 conventional parcels with turf, and a random selection of 210 water-wise parcels that did not participate in the rebate program.
Sociodemographic characteristics of residents and physical features of the landscape
We used data from the American Community Survey (ACS) to examine relationships between the prevalence of water-wise yards and sociodemographic characteristics that we hypothesized might influence residents’ desire and ability to install water-wise landscaping. We considered race/ethnicity, median household income, educational attainment, owner occupancy, households with children, and age of housing development. For race/ethnicity, we considered the percent of the population that was White, Black, Asian American, and Hispanic, and for educational attainment, we considered the percent of the population that had graduated high school and the percent with a bachelor’s degree or higher. We also included the percent of households with children up to 18 years old. Age of development was calculated from the median year structures in the census tract were built. These data were obtained at the census tract level, using the 2012–2016 five-year estimates to match the timeframe of landscape conversion prior to our sampling. Distributions of these variables are shown in Table 1.
Distribution of sociodemographic and biophysical variables included in analysis for 100 census tracts (n = 100) in Sacramento
| Variable | Mean | Median | Min. | Max. | SD |
|---|---|---|---|---|---|
| White population (%) | 51.5 | 48.8 | 16.9 | 92.1 | 18.2 |
| Black population (%) | 12.6 | 11.4 | 0.3 | 32.7 | 7.4 |
| Asian population (%) | 18.0 | 16.7 | 1.3 | 49.0 | 11.4 |
| Hispanic population (%) | 28.1 | 26.1 | 5.5 | 59.1 | 12.9 |
| High school deg. or higher (%) | 82.9 | 85.3 | 48.6 | 98.6 | 11.8 |
| Bachelor’s deg. or higher (%) | 30.3 | 29.6 | 3.1 | 72.5 | 19.6 |
| Owner occupied units (%) | 52.1 | 53.3 | 9.1 | 86.1 | 17.1 |
| Households with children (%) | 31.1 | 32.0 | 3.6 | 51.4 | 11.0 |
| Median household income ($) | 55,976 | 50,541 | 22,977 | 123,684 | 24,470 |
| Age of development in 2018 (years) | 48.1 | 50 | 13 | 79 | 18.6 |
| Median parcel area (ha) | 0.06 | 0.06 | 0.03 | 0.1 | 0.01 |
| July temperature (°C) | 33.2 | 33.4 | 30.3 | 35.4 | 1.1 |
| Tree canopy cover in (%) | 28.5 | 30.8 | 1.0 | 52.1 | 12.0 |
We also included biophysical variables in our analysis that could affect a resident’s decision to install water-wise landscaping: median parcel size, percent tree canopy cover, and mean July temperature. Parcel size was calculated in ArcGIS from the parcel map layer used for sampling. Percent tree canopy cover over the SFH parcels was determined using eCognition object-based image analysis software (Zhou and Troy 2008). To calculate mean July temperature for each census tract, we used land surface temperature from 2015 Landsat 8 satellite imagery, processed in ESRI ArcGIS software (Orhan and Yakar 2016). Distributions of these variables are shown in Table 1.
Data analysis
To see whether census tracts with greater participation in the rebate program also had a higher prevalence of water-wise yards overall, we used a Spearman rank correlation test to compare the percent of SFHs that were rebate participants to the total percent of SFHs that were water-wise. Due to the small number of yards classified as “in progress,” these parcels were included with water-wise yards for analysis.
To evaluate whether rebate participants and other parcels with water-wise yards tended to have more water-wise neighbors than parcels with conventional yards, we used a binomial regression model with yard type as the predictor (rebate participant, independent water-wise, and conventional). The outcome variable for this model was the proportion of the nine nearest neighboring SFH parcels that were classified as water-wise. We included an observation-level random effect in this model to account for overdispersion (Harrison 2015) and used a Tukey test to determine whether means were significantly different among different parcel types.
Preliminary analysis of our sociodemographic and biophysical predictors indicated high levels of correlation between many pairs of variables (Fig. 2), and preliminary logistic regression analysis using the proportion of water-wise yards per census tract as the dependent variable showed multiple significant three-way interactions among overlapping combinations of predictors, as well as high variance inflation factors with or without interactions included. These qualities preclude straightforward interpretation of parameters in multivariate regression models (Dormann et al. 2013), and because our interest was descriptive, we assessed relationships between the percent water-wise yards per census tract and sociodemographic and biophysical variables using Spearman rank correlation coefficients. We also calculated Spearman rank correlation coefficients between percent rebate participants and sociodemographic and biophysical variables.
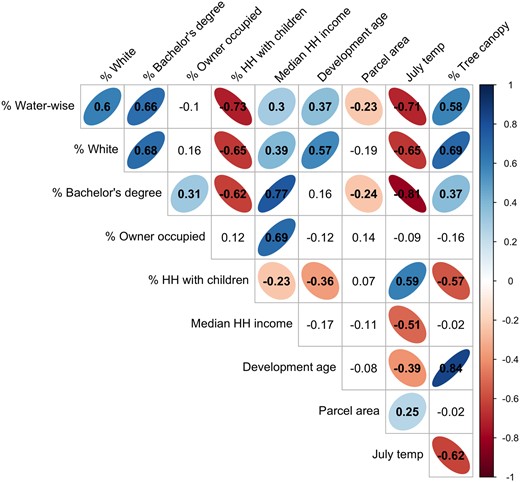
Visualization of the Spearman rank correlations between percent water-wise yards and sociodemographic and landscape variables for 100 census tracts (n = 100) in Sacramento. The darkness of the color and the width of the ellipse reflect the strength and certainty of the correlation. Ellipses are only shown for significant (P < 0.05) correlations. For race/ethnicity and education, only the variable with the strongest correlation to percent water-wise yards is included. Note: HH = household.

All analyses were carried out in R (R Core Team 2023). We used the “lme4” package to run the binomial regression model (Bates et al. 2015) and the “multcomp” package to perform the Tukey test on this model (Hothorn, Bretz, and Westfall 2008).
Results
We sampled a total of 109,062 SFHs in 100 census tracts across Sacramento. Approximately 10% of parcels city-wide were classified as water-wise (Table 2). The percent of SFH parcels per census tract that were classified as water-wise varied from 1.24% to 44.37% (Fig. 1); however, only four census tracts had >25% water-wise parcels.
Total numbers and percentages of different front-yard classifications for single-family homes across the city of Sacramento
| Yard classification | Total number | Percent total SFHs |
|---|---|---|
| Water-wise | 10 442 | 9.6 |
| Full | 6565 | 6.0 |
| Partial | 3877 | 3.6 |
| Conventional | 97 978 | 89.8 |
| Turf | 96 248 | 88.3 |
| No turf | 1730 | 1.6 |
| In-progress | 484 | 0.4 |
| Other | 158 | 0.1 |
| Total | 109 062 | 100 |
Properties that participated in the rebate program were found in 73 of the 100 sampled census tracts, and the number of participants in these tracts ranged from 1 to 14. Census tracts with greater participation in the rebate program also had a greater percentage of water-wise yards overall (ρ = 0.66, P < 0.001).
Rebate participants had a mean of 1.29 neighboring water-wise parcels out of the nine nearest SFH parcels, while the mean for independent water-wise yards was slightly greater at 1.61; conventional yards had a mean of 0.83 neighboring water-wise parcels (Fig. 3). On average, both rebate participants and independent water-wise yards had significantly more neighboring water-wise properties than conventional parcels (P < 0.001), while the difference between rebate participants and independent water-wise yards was marginal (P = 0.05).
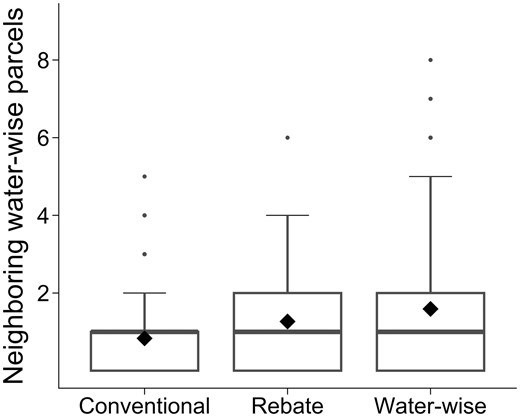
Boxplots summarizing the number of water-wise neighboring parcels (out of 9) for each type of yard (n = 210 for each yard type). “Rebate” refers to parcels that participated in the City of Sacramento turf replacement rebate program, while “water-wise” refers to parcels with water-wise landscaping that did not participate in the rebate program. Boxes show median values bounded by first and third quartile values, with whiskers extending to the smallest and largest values at most 1.5 times the interquartile range; diamonds show mean values.

All evaluated sociodemographic and biophysical variables except for percent owner occupancy were significantly correlated with percent water-wise yards (Table 3). The variables with the strongest positive correlations with percent water-wise yards (ρ ≥ 0.60) were the percent White population, educational attainment of a bachelor’s degree or higher, and the percent tree canopy cover. The variables with the strongest negative correlations with percent waterwise yards (ρ ≤ -0.60) were the percent of households with children 18 years old or younger, and July temperature. Many of these variables were correlated with one another (Fig. 2). The relationships between percent rebate participants and sociodemographic and biophysical variables followed very similar trends, although percent owner occupancy had a weak positive relationship (P = 0.06) while median parcel area had no significant relationship (Table 3).
Spearman correlation coefficients (ρ) relating the percent of water-wise yards and percent of turf replacement rebate program participants to sociodemographic and landscape variables for 100 census tracts (n = 100) in Sacramento.
| Water-wise yards | Rebate participants | |||
|---|---|---|---|---|
| Variable | ρ | Significance | ρ | Significance |
| White | 0.60 | P < 0.001*** | 0.63 | P < 0.001*** |
| Black | −0.37 | P < 0.001*** | −0.37 | P < 0.001*** |
| Asian | −0.36 | P < 0.001*** | −0.37 | P < 0.001*** |
| Hispanic | −0.52 | P < 0.001*** | −0.42 | P < 0.001*** |
| High school deg. or higher | 0.59 | P < 0.001*** | 0.58 | P < 0.001*** |
| Bachelor’s deg. or higher | 0.66 | P < 0.001*** | 0.61 | P < 0.001*** |
| Owner occupied | −0.10 | P = 0.33 | 0.19 | P = 0.06 |
| HH with children | −0.73 | P < 0.001*** | −0.60 | P < 0.001*** |
| Median HH income | 0.29 | P = 0.003** | 0.34 | P < 0.001*** |
| Age of development | 0.37 | P < 0.001*** | 0.36 | P < 0.001*** |
| Median parcel area | −0.23 | P = 0.02* | −0.06 | P = 0.57 |
| July temperature | −0.71 | P < 0.001*** | −0.55 | P < 0.001*** |
| Tree canopy | 0.58 | P < 0.001*** | 0.48 | P < 0.001*** |
HH = household.
Discussion
Our census of single-family residential yards in the water-limited city of Sacramento revealed that the vast majority of water-wise yards were installed independently from the municipal rebate program. The rebate program is therefore unlikely to be the primary driver of turf replacement in this city, and rebate data are also insufficient for understanding the extent and distribution of water-wise landscaping in Sacramento. This finding likely applies to other cities as well. The spatial clustering of water-wise yards in our study suggests a neighborhood adoption effect, which could indicate that rebate program participants and early adopters of water-wise landscaping practices help motivate neighbors to replace their turf independently. However, high proportions of water-wise landscaping were generally found in areas where populations had greater resources to invest in their yards and where fewer households had children (Fig. 2), suggesting that water-wise landscaping may not be accessible or desirable for all.
Most water-wise landscaping is independent of the rebate program
In Sacramento, there were more than 30 times as many SFH yards with water-wise landscaping as there were participants in the municipal turf replacement program. This magnitude of difference indicates that the rebate program is not driving the patterns of turf replacement observed in Sacramento. Instead, it is likely that the distribution of residents who already wished to replace their turf is driving the distribution of rebate participants. Research has shown that many turf removal rebate participants are homeowners who would have converted their yards even without a rebate (Addink 2005), and that rebates are not a primary motivator for lawn removal (Hartin, Surls, and Bush 2022). However, the availability of a rebate likely does make turf replacement financially feasible or attractive for some, increasing the total number of lawn conversions—indeed, a survey of Sacramento’s rebate program participants found that more than half listed the rebate as one of the reasons they decided to change their landscape (AWE 2019). When the rebate was temporarily doubled to $3.00 per square foot in 2021, participation in the program surged (W. Granger, personal communication, Dec 12, 2022). This dramatic increase in participation suggests that residents may not perceive the baseline rebate of $1.50 per square foot to be a sufficient incentive to justify the constraints and requirements of the rebate program, which could be seen as restrictive or cumbersome. The many residents choosing to replace their turf independently may be doing so to avoid the paperwork or the policies associated with the rebate program, or may simply be unaware of the rebate opportunity. Others may have become ineligible by letting their lawns die during times of drought—the program required that turf be maintained at the time of the pre-inspection site visit to receive the full rebate.
Water-wise landscaping is spatially clustered
The uneven distribution of water-wise yards across the city of Sacramento indicates spatial clustering of water-wise landscaping on a broad scale, and our finding that water-wise yards tend to have more water-wise neighbors supports the idea that water-wise landscaping is also clustered at a much finer neighborhood scale. This “neighborhood adoption effect” was also observed in southern California, where studies of two different rebate programs showed that approximately a third of sampled participants had a water-wise neighbor (Matlock, Whipple, and Shaw 2019; Pincetl et al. 2019). These findings could indicate that neighbors inspire each other to replace their turf by providing examples and sharing knowledge or resources. For instance, the Sacramento rebate program has seen cases in which multiple participants are located on the same street and use the same landscaping company (W. Granger, personal communication, Jan 5, 2023). Conversely, some neighborhoods are governed by homeowner associations (HOAs) that may prohibit turf replacement, creating spatial clusters of purely conventional turf landscaping.
Early adopters of water-wise landscaping could also be initiating a shift in neighborhood aesthetic norms. Studies of residential landscape preferences repeatedly show that the number one priority with regard to yard design is aesthetics (Blaine et al. 2012; Larson and Brumand 2014; Hayden et al. 2015; AWE 2019), and although aesthetic preferences vary, they are strongly influenced by socialization and social norms (Yabiku, Casagrande, and Farley-Metzger 2008; Blaine et al. 2012; Larson and Brumand 2014). Homeowners also tend to manage their landscapes to uphold the ecological identity of their neighborhood (Grove, Locke, and O'Neil-Dunne 2014), and the desire to conform with neighborhood norms can be strong enough to overcome the broad cultural norm of turfgrass lawns (Nassauer, Wang and Dayrell 2009). As water conservation messaging is beginning to shift perceptions of prestige away from lush green landscaping towards water-efficient landscaping (McCumber 2017), residents who replace their turf with attractive water-wise landscaping may set a new aesthetic standard for their neighborhood. At the time of our sampling, this effect was not very strong: only a handful of water-wise yards had more than four water-wise neighbors out of nine, and the median number of water-wise neighbors for all yard types was one. However, our sampling was conducted relatively early in what we consider an increasing trend. We recorded a substantial number of yards that were in the process of conversion during our short sampling period (Table 2), suggesting that a neighborhood adoption effect may be in progress. Without asking about residents’ motivations, though, it is not possible to determine whether the observed neighborhood adoption effect is truly the result of influence, or simply the result of households with similar characteristics being clustered.
The distribution of water-wise landscaping and rebate program participation is related to sociodemographic and biophysical factors
The many strong correlations among sociodemographic and biophysical variables in Sacramento (Fig. 2) make it difficult to tease apart their relative influence on the prevalence of water-wise landscaping and rebate program participation; however, water-wise landscaping and rebate participation were both generally associated with greater social and economic privilege. We found that water-wise landscaping and rebate program participation in Sacramento were more common in census tracts characterized by higher educational attainment, whiter populations, fewer families with children, higher income, older development, greater tree canopy cover, and lower July temperatures. These characteristics are all interrelated, and all may have individual or combined influences on decisions about water-wise landscaping. We discuss some of the possible causal and associative connections below.
We anticipated the positive association between household income and water-wise landscaping because high costs have been identified as a barrier to landscape transformation (AWE 2019). Additionally, residents with lower income are generally less likely to spend money on yard maintenance and have shown a preference for turf landscaping (Larsen and Harlan 2006; Blaine et al. 2012). Interestingly, the positive association between household income and rebate participation was stronger than the association with water-wise yards overall. While this result should be interpreted with caution given the small total number of rebate participants, it does suggest that the rebate program is insufficient to overcome the cost barriers and encourage turf conversion in less affluent areas. As it stands, lawn conversion is a luxury—even with the help of a municipal rebate program, residents must bear the full cost of the landscape conversion up front, limiting participation in low-income communities (Feinstein et al. 2017), and rebates generally do not cover the entire cost of the project (AWE 2019). Although the cost savings associated with reduced irrigation should ultimately save a household money after conversion, it can take years to recover the initial investment even with a rebate (Jessup, DeShazo, and Panjwani 2016), making this cost-savings unattainable for those without sufficient resources to dedicate to the conversion.
While we expected that household income would be a strong predictor of water-wise landscaping, the correlation was relatively uncertain. This uncertainty may reflect a conflicting relationship between income and landscaping in which some high-income areas of Sacramento uniformly maintain pristine lawns as a signal of economic value and status (Simpson et al. 2023). It also suggests that other factors may be more influential in determining the distribution of water-wise landscaping in Sacramento. Educational attainment, for instance, showed a much stronger association than household income. Past studies have linked higher education to greater environmental concern and participation in environmentally friendly practices (Dunlap et al. 2000; Gregory and Leo 2003), which could help to explain this association. However, in contrast to our findings, other studies have reported either no relationship or only a slight influence of education on landscape preferences (Hurd 2006; Yabiku, Casagrande, and Farley-Metzger 2008; Nassauer, Wang and Dayrell 2009; Cook, Hall, and Larson 2012; Peterson et al. 2012). In Sacramento, the role of higher educational attainment may instead be to connect residents to institutions that promote and support lawn conversion, such as the University of California, the Sacramento Tree Foundation, and city and state governments. Exposure to resources and messaging from these institutions may increase implementation of water-wise landscaping. Furthermore, highly educated residents may feel more confident doing research to make choices about landscape design and irrigation systems, which many residents reported they would need help with in order to replace their lawns (AWE 2019).
We also found a very strong negative relationship between the prevalence of households with children and the prevalence of water-wise yards and rebate program participants. Since raising children requires substantial financial resources (Lino et al. 2017), households with children may have fewer discretionary funds to devote to landscaping than households of the same income level without children, potentially helping to explain the stronger association between water-wise landscaping and children than overall income. In addition, a higher percentage of households with children at the census tract level was associated with lower educational attainment and lower household income overall, which could strengthen the association. Furthermore, families with children may also prefer to maintain turfgrass as a space for recreation or play (Yabiku, Casagrande, and Farley-Metzger 2008; Larson et al. 2009). They may also have limited time to devote to landscaping projects. The combination of lower discretionary resources and different landscaping functional priorities for households with children is likely contributing to the low numbers of water-wise yards we found in some parts of the city.
The biophysical characteristics of the urban landscape also create conditions and constraints that likely influence patterns in the distribution of water-wise landscaping across the city. For instance, median parcel size was negatively correlated with water-wise landscaping. This finding could be explained by the relative ease of managing turf on larger parcels through landscaping services (colloquially known as “mow and blow”) rather than manually pulling weeds from alternative groundcover such as rock or mulch (Larson et al. 2009), or by the increased difficulty and cost of implementing a landscape transformation in larger yards. In fact, we found that there was a significant positive association between median parcel size and the proportion of water-wise yards that were only partially converted (analysis not shown), suggesting that residents with larger yards are more likely to replace only a section of turf. The lack of a significant relationship between parcel size and rebate program participation suggests that the rebate may help overcome obstacles to lawn conversion associated with larger parcels.
Biophysical, social, and historical factors likely interact to explain our finding that areas of Sacramento with lower tree canopy and associated higher average July temperatures tend to have fewer water-wise yards. It is possible that residents who experience hotter summer temperatures and more direct sun are more interested in maintaining turf lawns for the cooling effect they provide through evapotranspiration (Feldhake, Danielson, and Butler 1984). However, this trend might instead be explained by the historical context of the city’s development. Extensive planting of street trees early in Sacramento’s history has led to mature tree canopy in the downtown core and its oldest suburbs, while recently developed areas have much lower canopy cover, as evidenced by the very tight correlation between development age and tree canopy (Fig. 2). These areas of older development are also strongly associated with whiter populations. In addition, greater tree canopy and lower July temperatures were strongly associated with more highly educated populations with fewer children (Fig. 2). Thus, the populations associated with cooler, shadier, older areas of the city could be the most important factor explaining the greater prevalence of water-wise landscaping there; in addition, residents in these areas experience less heat and direct sun that might dissuade them from replacing their turf.
We were surprised to find no significant correlation between owner-occupied households and the prevalence of water-wise yards, as we expected this type of investment to be more commonly implemented by homeowner residents. However, water-wise landscaping can be very low maintenance (Jessup, DeShazo, and Panjwani 2016), and landlords may prefer installing drought-tolerant perennials to negotiating consistent lawn care with tenants or paying for lawn care services. On the other hand, this finding could highlight an important issue with using aggregated census data for this type of analysis. Census tracts often cover heterogeneous areas, and their demographics are also based on all residents—not just those living in single-family homes. In neighborhoods with more apartment buildings and multi-family housing, the overall owner occupancy rate may be relatively low, while the owner occupancy rate of single-family homes could be higher. More broadly, while all the trends we have identified are suggestive of underlying patterns, we cannot link the average sociodemographic or biophysical characteristics of entire census tracts to the individual properties with water-wise landscaping.
Management implications
Turf replacement is increasingly promoted as a water conservation measure, as evidenced by the unprecedented investment in turf-replacement rebate programs by regional water providers and the general popularity of turf removal rebates offered by local governments, especially in the water-limited cities of the western United States (Addink 2005; MacSwain et al. 2013; Pincetl et al. 2019). This growing popularity has also prompted questions about whether these programs are a sound investment that will lead to substantial water savings without unintended consequences. One concern is that attempts at water-wise landscaping do not always save water—without adequate knowledge of appropriate plants to install or their irrigation needs over time, turf replacement can result in the same or more water being used on the landscape (St Hilaire et al. 2008). However, numerous studies of household water use do suggest that turf replacement rebate recipients save water on average, with reported annual water savings ranging from around 240–460 gallons/m2 of converted turf for programs in California (Baum-Haley 2013; Erler & Kalinoski, Inc 2016; Laur 2020; Matlock, Whipple, and Shaw 2019). An analysis of Sacramento’s rebate participants from 2014–2015 showed an average 29.6% reduction in water use after conversion (AWE 2019). Although most studies only evaluate water savings in the year or two after turf removal, longer-term datasets show that water savings actually increase over time as vegetation matures (AWE 2019; Bijoor 2021).
Another concern is that water-wise landscaping will increase urban heat. In Arizona, researchers found that “zeroscaped” yards, which removed turf without adding any vegetation, experienced much hotter temperatures than “xeriscaped” yards with drought-tolerant plantings or “mesic” landscapes featuring turfgrass lawns (McPherson 1990). On a neighborhood scale, converting 50% of mesic yards to xeric landscaping was predicted to increase evening temperatures by ∼1°C in Arizona (Chow and Brazel 2012), while in dryland cities globally, irrigated turf and tree landscapes were found to be on average 4°C cooler than xeriscaped areas that included substantial amounts of bare ground (Dialesandro, Wheeler, and Abunnasr 2019). Artificial turf, while not supported by many turf replacement rebate programs, is commonly installed independently and can increase surface temperatures by more than 20°C over natural turf (Petrass et al. 2015). The distribution and design of water-wise yards could therefore have important effects on the thermal comfort of residents, impacting the livability of water-limited cities.
To address concerns about heat and water use, many turf replacement rebate programs like Sacramento’s have resources and requirements aimed at ensuring vegetative coverage with appropriate plants, as well as water conserving irrigation systems. However, there is little opportunity to follow up with rebate recipients after landscapes have been installed. More importantly, these requirements do not apply to the independent lawn conversions that comprise most water-wise yards in Sacramento. The number of independent lawn conversions is likely to increase further as Sacramento transitions from its historical flat-rate water bill to a pay-by-use billing system, which could allow the City to discourage profligate irrigation through rate hikes for high water users. Increasing the cost of water has been found to increase homeowner preference for water-conserving landscapes (Hurd 2006). However, this strategy could create an environmental justice concern. Water pricing has been shown to have little impact on water consumption for wealthy residents, who tend to be the highest users, whereas increasing costs can jeopardize the well-being of lower-income residents who use less water overall (Pataki et al. 2011; Mini, Hogue, and Pincetl 2014b). Indeed, Simpson et al. (2023) found that residents of a wealthy, predominantly white neighborhood in Sacramento were bypassing water conservation policy to maintain lush lawns despite drought conditions, while residents of a nearby lower-income, more diverse neighborhood ended up with drought-damaged, poor-quality lawns rather than intentional water-wise landscaping. This finding is consistent with our results showing that water-wise yards were less common in areas with a greater proportion of people of color. Future work to evaluate the quantity and health of front-yard vegetation in relation to water use data would enhance our understanding of the effectiveness of different landscaping interventions as water conservation measures, as well as the ways in which water conservation may be differentially and inequitably impacting the benefits that residents derive from their landscaping.
Conclusion
As urban water conservation becomes an increasingly pressing issue in the American West and worldwide, promotion of water-efficient landscaping has become an important strategy to curb residential water use. New developments in California are now required to follow guidelines for landscape water efficiency, but for existing neighborhoods, incentives like Sacramento’s turf replacement rebate program are commonly employed to encourage residents to voluntarily reduce their water use (St Hilaire et al. 2008). Our study shows that in Sacramento, relatively few residents take advantage of this rebate, despite the substantial and increasing number of water-wise yards in the city. In addition, our study shows that water-wise yards in Sacramento are clustered in areas with certain characteristics, and that the rebate is reaching the same populations that are replacing their turf independently—populations that tend to be more highly educated, less diverse, less likely to have children, and to have higher incomes. This pattern suggests a potential environmental justice concern, and further research to determine residents’ reasoning for their landscaping choices would be valuable to assess the extent to which turf replacement is an accessible or desirable option for households across the city. Such research would also help to determine the full impact of the rebate program in stimulating water-wise yard conversions due to neighborhood influence and increased awareness, and could suggest strategies to reach more diverse communities.
The general socioeconomic patterns we observed in Sacramento are likely to be broadly applicable, given the investment of time, money, and knowledge necessary to undertake a landscape conversion. However, cities with different water pricing structures may see different relationships between income and water-wise landscaping, and this relationship may shift in Sacramento as new pay-by-use rate structures are introduced. In addition, relationships to biophysical factors may differ in cities with contrasting climates and development histories. In Sacramento, tree canopy cover has a strong positive correlation with development age, but this relationship does not hold for all cities (Lowry, Baker, and Ramsey 2012). In cities where summer heat is less severe, or where population trends are differently coupled to development patterns, tree canopy cover and July temperatures may be unrelated to water-wise landscaping. In Sacramento, the relationship between heat and water use requires particular attention and consideration of long-term impacts. Although trees require water, increasing canopy cover may ultimately reduce landscape water use if increased shading and associated decreased heat are tied to a willingness to remove lawns. Conversely, if turf replacement is associated with a decrease in overall landscape vegetation or a loss of canopy cover due to tree water stress, damage, or removal, water-wise conversions could lead to increased temperatures, possibly even inspiring a gradual reversion to turf landscaping. Now that the City of Sacramento has installed water meters, future research could track associations among landscape change, water use, and heat over time, and particularly compare outcomes for rebate participants to those for independent conversions.
Acknowledgements
The authors would like to thank William Granger, Roshini Das, and Bryn Montgomery for their assistance with data used in this analysis.
Author contributions
Jasmin C. Green (Conceptualization-Supporting, Data curation-Supporting, Formal analysis-Supporting, Investigation-Lead, Methodology-Supporting, Supervision-Supporting, Writing—original draft-Lead, Writing—review & editing-Supporting), Joanna P. Solins (Conceptualization-Supporting, Data curation-Supporting, Formal analysis-Lead, Methodology-Supporting, Visualization-Equal, Writing—review & editing-Lead), Logan E. G. Brissette (Conceptualization-Supporting, Data curation-Lead, Investigation-Supporting, Methodology-Supporting, Visualization-Equal, Writing—review & editing-Supporting), Tracy L. Benning (Conceptualization-Supporting, Methodology-Supporting), Kennedy Gould (Investigation-Supporting, Methodology-Supporting), Emily M. Bell (Investigation-Supporting, Methodology-Supporting), and Mary L. Cadenasso (Conceptualization-Lead, Funding acquisition-Lead, Methodology-Lead, Project administration-Lead, Resources-Lead, Supervision-Lead, Writing—review & editing-Supporting)
Funding
This project received funding from the Faculty Research Grants Program, Academic Senate, UC Davis, to MLC.
Conflict of interest statement
None declared.
Data availability
Data are available upon request by contacting the corresponding author.