 https://orcid.org/0000-0002-0467-7794
Abstract
Zooplankton play a crucial role in the biological carbon pump by producing sinking particles including sloppy feeding by-products, fecal pellets, molts and carcasses. However, quantifying their impact of these particles on the carbon cycle remains difficult. The contribution of fecal pellets to particulate organic carbon export is usually assessed using fecal pellets collected from sediment traps and laboratory studies. Here, we identified 50 771 fecal pellet-like particles distributed across three morphological clusters. These were extracted from 987 236 in situ images of non-living particles collected from Baffin Bay (Arctic Ocean) using the Underwater Vision Profiler (UVP). We associated which taxonomic groups produced the fecal pellets by comparing the UVP images with observations of fecal pellet morphology and length. Our results emphasize the feasibility of quantifying fecal pellets from in situ images and the importance of developing the resolution of imaging tools that would simultaneously identify smaller fecal pellet-like particles and capture images of large crustacean zooplankton. Using in situ images in identifying fecal pellets will facilitate a better understanding of their dynamics, a more accurate calculation of carbon fluxes, and the representation of fecal pellets in biogeochemical models.
INTRODUCTION
Zooplankton play an important role in the biological carbon pump (BCP) (Cavan et al., 2017; Steinberg and Landry, 2017; Nowicki et al., 2022). The BCP is the process by which organic matter created through photosynthesis is transported from the surface layer to the deep ocean, where it can be sequestered for decades or even centuries (~5–12 Gt in the mesopelagic layer) (Henson et al., 2012; Siegel et al., 2023). Zooplankton contribute to the BCP by producing sinking particulate organic matter in the form of fecal pellets, molts and carcasses (Steinberg and Landry, 2017). Diel vertical migrations performed by some zooplankton species allow the active transport of fecal pellets into the deep layers, amplifying the BCP and accounting for ~ 16% of the total Particulate Organic Carbon (POC) flux (Archibald et al., 2019).
Fecal pellets have a high sedimentation rate and are slowly remineralized (Turner, 2015). They are relatively well-studied, yet their contribution to the POC flux displays large variations, ranging from < 1% to 100% (Turner, 2015). The spatio-temporal variability in fecal pellets contributions to POC flux is dependent on the composition of the zooplankton community and their diet. In Baffin Bay (Canadian Arctic), the contribution of fecal pellets to the POC flux measured using sediment traps varied between 1% and 63% (Sampei et al., 2004). Fecal pellets are usually collected from sediment traps (Laurenceau-Cornec et al., 2015; Miquel et al., 2015) or laboratory incubation studies (Urban-Rich et al., 1998; Seuthe et al., 2007). Thanks to a large body of literature on zooplankton fecal pellet production and export, the major taxonomic group of the pellet producer can generally be inferred from the shape and size of the pellets: for example, salps produce tabular fecal pellets, while krill produce cylindrical, filiform ones (Moore, 1931; Wilson et al., 2008; Belcher et al., 2017). Still, it is challenging to study fecal pellets in controlled laboratory conditions representing the broad range of biological (e.g. zooplankton assemblage and food sources) and physical (e.g. turbulence, stratification, etc.) conditions experienced in situ (Honjo and Roman, 1978; Romero et al., 2000).
The development of in situ imaging tools, such as the Underwater Vision Profiler (UVP) (Picheral et al., 2010, 2022), allows for the photography and measurement of a large number of morphological descriptors of marine particles in their natural environment with little perturbation (Stemmann et al., 2012; Ratnarajah et al., 2023). This tool may additionally provide images of fecal pellets and provide information on zooplankton behavior and their interactions with marine snow (Orenstein et al., 2022). A few studies used known fecal pellet producer-shape relationships to train machine learning algorithm and automatically classify the types of fecal pellets sampled with sediment traps (Durkin et al. 2021) or directly imaged in situ, in the latter case only for salp fecal pellets owing to their distinctive shape and size (Steinberg et al. 2022).
We used high resolution imaging and machine learning to test whether fecal pellets can be identified based on their morphology and distinguished from among the UVP images of marine snow, and whether fecal pellet abundance and their origin can be reliably estimated from in situ images collected in Baffin Bay. The Arctic Ocean is a particularly suitable place to test the feasibility of identifying fecal pellets from in situ images as the shorter productive season of zooplankton (Perrette et al., 2011; Daase et al., 2021) increases the probability to capture periods of high fecal pellet export (Buesseler, 1998). Furthermore, Arctic marine ecosystems are typically dominated by large zooplankton such as copepods reaching body lengths of 3–7.5 mm and amphipods and euphausiids with body lengths to a few centimeters. These important taxa produce elongated and cylindrical fecal pellets that are within the size range of particles captured in in situ imaging (Romero et al., 2000; Miquel et al., 2015). Finally, we then discussed the potential of image-derived fecal pellet data to better understand their importance in the BCP.
METHODS
Baffin Bay
Sampling was conducted in Baffin Bay, located between Greenland and Baffin Island in Canada, during the GreenEdge campaign in June and July 2016 aboard the Canadian Coast Guard Ship Amundsen (Fig. 1). The objective of the campaign was to better understand the processes controlling primary productivity and the fate of the organic matter produced during the Arctic phytoplankton spring bloom (Bruyant et al., 2022). In total, 203 stations along seven transects were sampled across the ice edge.
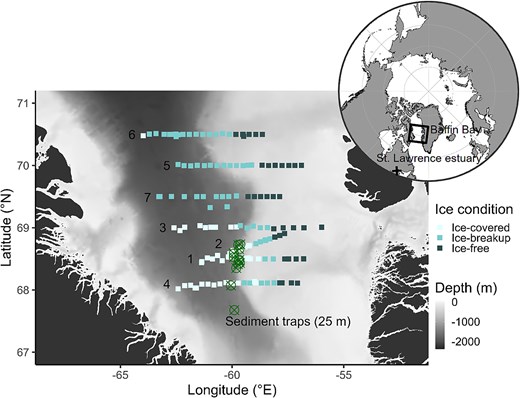
Stations sampled during the Green Edge project across the ice edge in Baffin Bay in June and July 2016. Transects are numbered chronologically. Reported locations of the drifting sediment trap are shown with cross-circle symbols. Baffin Bay and the St. Lawrence maritime estuary are indicated on the Arctic Ocean map. Zooplankton communities from the St. Lawrence are strongly influenced by Arctic water masses flowing along the Labrador shelf and entering through the Strait of Belle-Isle.

Baffin Bay has strong hydrographic gradients. Arctic waters flow southward on the western side of the bay, while warmer and saltier Atlantic waters (below 100 m) flow northward on its eastern side. This east–west gradient is intensified by the strong seasonality of the sea-ice dynamics. In 2016, sea ice started to melt around June 10 on the eastern side and gradually disappeared towards the west a month later (Randelhoff et al., 2019). Since ice strongly affects ecosystem dynamics, each station was assigned an Open Water Days value (see Randelhoff et al., 2019) and then grouped by sea-ice condition: ice-free, ice-breakup and ice-covered (Fig. 1).
Underwater vision profiler—image acquisition and fecal pellet identification
The Underwater Vision Profiler 5 (UVP5) (Picheral et al., 2010) was mounted within the CTD rosette to image mesozooplankton and non-living particles in the water column. Each source image represented a volume of 1.15 L. In the source images, all objects greater than 3 pixels (~64 μm in diameter) were detected and counted, and individual images were saved if objects were larger than 80 pixels (~900 μm in diameter). Morphological descriptors were calculated for each individual image of non-living and living particles using the ZooProcess software (Gorsky et al., 2010). Individual images, their metadata and their morphological descriptors were stored in the EcoTaxa web application (Picheral et al., 2017) (https://ecotaxa.obs-vlfr.fr/; project “UVP5hd GreenEdge 2016 [149]”). Automatic taxonomic classification was performed on these images using a random forest algorithm (Irisson et al., 2022) (55 taxonomic categories from order-level to species-level). Taxonomic identification of each individual image was then validated by human experts. At the time of our analyses, this step was completed for only 162 stations out of the 203 sampled. We used images from the category of non-living particles (n = 987 236). The operation of the UVP5, as well as the image acquisition and segmentation methods are described in more detail in Vilgrain et al. (2021).
The novelty of our study lies in applying a morphological approach to distinguish cylindrical fecal pellets among non-living particles. To achieve this, the morphological space for all non-living particles was delineated by performing a weighted Principal Component Analysis (PCA) (Legendre and Legendre, 2012) on a selection of 18 morphological descriptors as described in Vilgrain et al. (2021). These 18 descriptors can be classified into four categories, describing the particle size (MajorAxis, MinorAxis, Area, FeretDiameter, Perimeter), transparency (MeanGrey, MedianGrey, Grey75%, StdDevGrey, SkewnessGrey), shape (Circularity, Elongation, ThicknessRatio, Symmetry, Symmetry75%) and complexity (Perim/Major, Perim/Feret, Fractal) (Table S1). In the construction of the PCA, morphological descriptors were weighted using the concentration of each particle. Thus, the most common (rarest) morphologies had more (less) weight in the construction of the PCA. To remove outliers, 0.1% of the extreme values of each descriptor were transformed into missing values. Then, all morphological descriptors were normalized using the Box-Cox transformation to satisfy the conditions for PCA application. Principal components (PC) were considered significant only if their associated eigenvalues were greater than the average of all the eigenvalues (Kaiser-Guttman criterion; Cattell, 1966). In this morphological space (Vilgrain et al., 2021; Irisson et al., 2022), individual particles can be represented as dots or example images can be mapped to their position.
Crustacean zooplankton produced elongated cylindrical fecal pellets. Hence, we used the PC1/PC2 coordinates of the morphological space to identify them. To create groups of morphologically similar particles, called clusters, we applied a k-means clustering (PC1/PC2 in Fig. 3A, but see PC3/PC4 in Fig. S2). After examining the results for cluster numbers between 2 and 50, the solution resulting in 37 clusters was chosen because the grouping was coherent from a morphological point-of-view. Clusters #13 (n = 16 909), #32 (n = 15 671) and #35 (n = 18 191) were identified to contained elongated particles that exhibited variable levels of transparency that were most likely to resemble cylindrical fecal pellets. Particles from these three clusters were then considered as pellet-like particles.
The vertical distribution in the abundance (# m−3) of pellet-like particles was integrated for 10 m depth bins from the upper 400 metres for each station. These profiles were then averaged for each sea-ice condition (ice-free, ice-breakup and ice-covered). Vertical profiles were similarly determined for all non-living particles as well as images classified as “copepoda”, “amphipoda”, “eumalacostraca” and other crustacean zooplankton in “crustacean”, thereafter named crustacean zooplankton.
Among the images classified as “copepoda” (n = 37 538), 18 images displayed both copepods and particles resembling cylindrical fecal pellets (Fig. 2A and Fig. S1), thereafter named potential fecal pellets. These were visible in the original images as routinely processed by ZooProcess. The fact that these particles were visible alongside a copepod may result from mis-segmentation, which kept one image of a particle together with one of a copepod, instead of segmenting two different images.
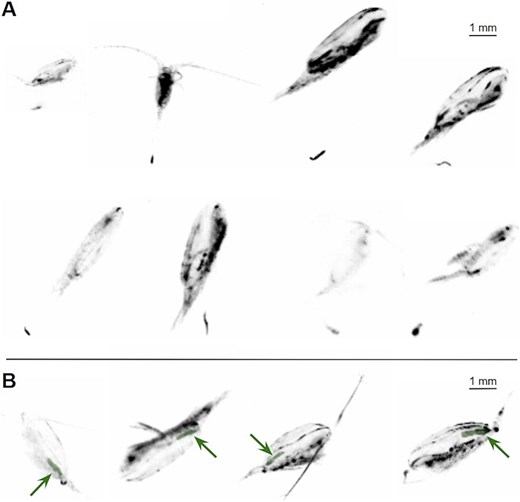
Underwater Vision Profiler 5 images of (A) copepods (prosomes measuring from 4.5 to 10.8 mm) and potential fecal pellets, and of (B) copepods with visible guts highlighted and indicated by arrows (guts measuring 2.06 mm, 1.77 mm, 1.64 mm and 1.84 mm from left to right).

To validate and assess the origin of the pellet-like particles identified in the three clusters, we measured the lengths of the potential fecal pellets (Fig. 2A) and the gut contents of a few individuals classified as “copepoda” when visible on UVP5 images (Fig. 2B), using GIMP 2.10.36 software. We also calculated the Pearson correlation coefficients and their associated p-values between the abundances of crustacean zooplankton and pellet-like particles in the upper 100 m of the three sea ice conditions.
Drifting sediment trap deployments and zooplankton net tows
Lengths of pellet-like particles from the UVP5 images were compared to lengths of fecal pellets collected by a drifting sediment trap (Technicap PPS4; 12 sampling cups) (Bruyant et al., 2022), deployed at 25 m depth under ice and programmed to rotate at 2-day intervals from June 15 to July 7 2016 in the southern Baffin Bay (Fig. 1). Prior to deployment, sediment trap sampling cups were filled with a filtered seawater-buffered formalin solution (5%) adjusted to a salinity of 37 to preserve the samples. In the laboratory, the lengths of fecal pellets (broken or intact) collected in each sample cup were measured using a dissecting scope with an ocular micrometer. A total of 3 769 cylindrical fecal pellets were measured (314 ± 564 per cup) and hereafter referred to as trap pellets.
Moreover, to compare the morphology of pellet-like particles to freshly produced ones, copepods were sampled in the St. Lawrence Estuary (Québec, Canada) at Rimouski station (48,79°N; −68,23°E, Fig. 1). The St. Lawrence Estuary is influenced by an Arctic current flowing south from Baffin Bay to Labrador Sea (Sutcliffe et al., 2011; Urrego-Blanco and Sheng, 2014). Hence, it forms an open window on Arctic marine ecosystems and was an easily accessible site to collect zooplankton in conditions similar to post-bloom period in Baffin Bay (e.g. Plourde et al., 2003; Brennan et al., 2024). A Hydro-Bios MultiNet mini was deployed in the upper 125 m of the water column at Rimouski station on August 15 and September 18 2023 to retain actively feeding individuals. Thus, the net tows were conducted seven years after the UVP5 images were acquired. Large Calanus spp. copepods of development stages C5 or C6 with full guts (n = 80) were selected for optimal fecal pellet production. Copepods were incubated individually in filtered water at 4°C and 28 PSU for 24 hours in Petri dishes, and 37 of them (prosome length of 3.3 ± 0.6 mm) produced a total of 147 fecal pellets (between 1 and 10 pellets per individual, 4.0 ± 2.2). Individual copepods and fecal pellets were photographed using a Leica IC90 camera mounted on a stereomicroscope. Fecal pellet lengths were then measured using the ImageJ v1.52k software. These pellets were then referred to as fresh pellets.
A Kruskal-Wallis analysis (Kruskal and Wallis, 1952) tested for any significant difference in the lengths and elongation ratios (length/width) of fecal pellets depending on their origin (clusters, fresh, trap, UVP5). This was followed by a Dunn pairwise test (Dunn, 1961) with Bonferroni p-values correction for multiple comparisons to assess the significance of the observed pattern (Dunn, 1961) (Fig. 4F and G). Finally, lengths of cylindrical fecal pellets produced by Calanus spp. and by euphausiids, mysids or amphipods were retrieved from the literature (Table S2). The literature-derived lengths were compared to lengths of the particles imaged by the UVP5, the three pellet-like particle clusters, the fresh pellets, the trap pellets and the UVP5 size range (Fig. 5).
Numerical tools
All statistical analyses were conducted in the programming environment R 4.2.3 (R Core Team 2023). The package tidyverse (Wickham et al., 2019) was used for data manipulations, vegan (Oksanen et al., 2022) and FactoMineR (Lê et al., 2008) for multivariate analysis. The packages RColorBrewer (Neuwirth, 2022), ggplot2 (Wickham et al., 2023), patchwork (Pedersen, 2024), ggrepel (Slowikowski et al., 2021) and cowplot (Wilke, 2020) were used to produce general graphics, ggOceanMaps (Vihtakari, 2024) and ggspatial (Dunnington et al., 2023) were used to produce the Arctic Ocean map, morphr (https://github.com/jiho/morphr) was used to represent individual images in the morphological space. All codes and raw data (except images) are available on GitHub (https://github.com/margauxperhirin/faecalparticles).
RESULTS
We identified 18 copepods that were imaged by the UVP5 together with a potential fecal pellet (Fig. 2A and Fig. S1). For those images, copepod prosome lengths were between 3.1 mm and 7.1 mm (5.2 ± 1.3 mm). The particles measured more than 1.2 ± 0.3 mm in length due to their possible non-horizontal orientation in the field of view of the camera, and 0.3 ± 0.1 mm in width. Visible full guts were measured on four images (Fig. 2B).
The first two PCA axes explained 67% of the total variance in non-living particle morphological traits (Fig. 3A). The traits related to circularity, transparency and elongation could best explain the variation of particles along the two axes. The three clusters considered to be fecal-pellet like particles were located at the bottom left section of the PCA (PC1 < 0 and PC2 < 0) representing the elongated cylindrical particles. A visual inspection of hundreds of images, confirmed that particle cluster #13, cluster #32 and cluster #35 contained elongated particles resembling cylindrical fecal pellets with various transparency levels. This observation matched images of crustacean zooplankton fecal pellets sampled seven years later in the St. Lawrence by incubating copepod individuals coming from the same Arctic species assemblage found in Baffin Bay (shape, complexity of the perimeter, extremities deterioration; photographs in Fig. 4A–E) and taken from literature (Fig. 3 in Cavan et al. 2015; Fig. 2 in Durkin et al., 2021; Fig. 5 in Laurenceau-Cornec et al., 2015; Fig. 8 in Møller et al. 2011).
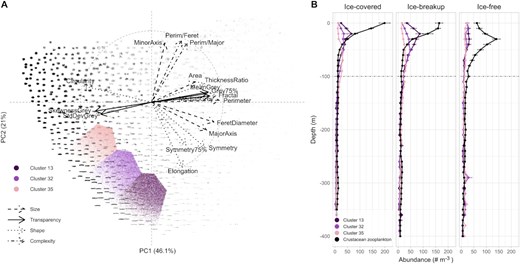
(A) Distribution of pellet-like particles from cluster #13, cluster #32 and cluster #35 along the two first significant axes of the morphological space of non-living particles imaged using the Underwater Vision Profiler 5 and (B) their abundance profiles along with those of crustacean zooplankton imaged (# m−3) in three sea-ice conditions. PC1 represents transparency and PC2 circularity. Background images reflected typical morphology of the particles in each location of the morphological space.

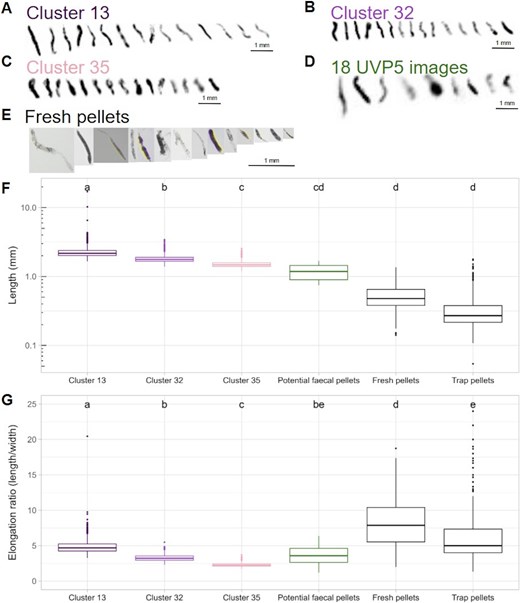
Images of particles from (A) pellet-like cluster #13, (B) cluster #32 and (C) cluster #35, and images (D) of the 18 potential fecal pellets and (E) of incubation pellets. Note the different scales in panel (E). Boxplots of the lengths (F, mm) and elongation ratios (G) of pellet-like particles identified from Underwater Vision Profiler 5 (UVP5) images in cluster #13 (n = 16 909), cluster #32 (n = 15 671) and cluster #35 (n = 18 191) or visually identified (n = 18), of copepod fresh pellets (n = 147) or of trap pellets collected in sediment traps (n = 3 769). Significant differences are indicated by letters (Kruskal-Wallis test followed by Dunn pairwise test; P < 0.05). Note the logarithmic y-axis for (F).

The lengths of pellet-like particles differed significantly between each cluster and were significantly longer than incubation pellets or trap pellets (P < 0.05, Fig. 4F). The elongation ratios were comparable regardless of the origin of the fecal pellets (Fig. 4G). Relative to the 18 potential fecal pellets imaged together with a copepod, the lengths were not significantly different from cluster #13, fresh pellets and trap pellets and the elongation ratios were not significantly different from cluster #32 and trap pellets (Fig. 4F–G).
Pellet-like particles were most abundant during the ice-breakup period (max. of 90 particles m−3 between 20 m and 30 m for cluster #13, Fig. 3B) and less abundant in the ice-covered period. In the ice-free condition, abundances remained relatively stable. Their vertical profiles differed from those of non-living particles (Fig. S1). During the ice-covered and ice-breakup conditions the more elongated particles of cluster #13 had a shallower maximum abundance while the least elongated particles of cluster #35 had the deepest maximum abundance (Fig. 3B). The maximum of abundances of the pellet-like particles were located slightly below those of crustacean zooplankton (Fig. 3B). A significant and positive correlation between the abundances of the pellet-like particles and the crustacean zooplankton in 0–100 m (Pearson’s correlation coefficient = 0.27, P = 0.028) was observed for the ice-breakup condition but not for the other conditions.
DISCUSSION
Our morphological approach enabled the identification of a significant number of pellet-like particles characterized by an elongated shape and varying transparency levels, distributed across three distinct size range clusters. The morphological resemblance between the pellet-like particles, the fresh pellets (Fig. 4A–E), the potential fecal pellets (Figs 2A and S1) and the cylindrical fecal pellets previously observed in the Arctic based on literature (Romero et al., 2000; Miquel et al., 2015) (Fig. 4) is strong evidence that these images are indeed of fecal pellets.
Lengths of these potential fecal pellets overlapped with those of trap and fresh pellets, as well as with the pellet-like particles from the three clusters (Fig. 5). However, the three clusters only captured the upper end of the size range of copepod fecal pellets, including larger values from fresh pellets or from the literature. They did not overlap with the size range of trap pellets. The three clusters’ elongation ratios corresponded to the lower end of the elongation ratios of both fresh and trap copepod fecal pellets. The elongation ratios based on images can be underestimated due to the potential non-horizontal orientation of the pellet-like particles in the camera’s field of view. Hence, pellet-like particles were not egested by small copepods like Calanus finmarchicus, C. glacialis or Metridia longa. While pelagic and mesopelagic fish also produce elongated fecal pellets, these tend to be significantly wider (ca. 1 mm) than our pellet-like particles (width < 0.8 mm for 95% of them) and generally longer, from a few mm up to more than a cm (Staresinic et al., 1983; Saba and Steinberg, 2012). Hence, these pellet-like particles were most likely not egested by fish either. Finally, by elimination and according to our literature review (Table S2), the size range of our three clusters corresponded better with lengths of fecal pellets from either Calanus hyperboreus or euphausiids (e.g. Meganyctiphanes norvegica, Thysanoessa sp.), mysids (e.g. Boreomysis sp.) or amphipods (e.g. Themisto libellula, T. abyssorum). Observed morphological differences might also reflect spatio-temporal variations in zooplankton communities and particles sampled in the boreo-arctic continuum extending from Baffin Bay in the north to the St. Lawrence Estuary in the south.
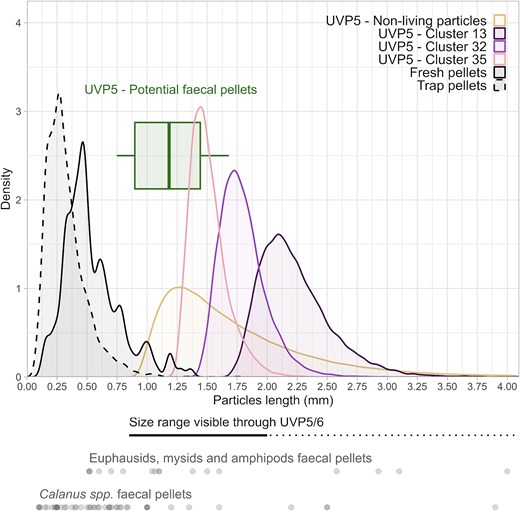
Size comparison of non-living particles imaged by the Underwater Vision Profiler 5 (UVP5) (n = 992 759; from EcoTaxa), of the pellet-like particles in cluster #13 (n = 16 909), cluster #32 (n = 15 671) and cluster #35 (n = 18 191), of copepod fresh pellets (n = 147), of trap pellets from the sediment trap (n = 3 769) and of the 18 potential fecal pellets visually identified from UVP5 images. Literature data for fecal pellets of Arctic Calanus spp. and euphausiids, mysids and amphipods are presented in gray (Table S2) as well as the size range visible by UVP5 in black, dotted for the entire range and solid for the quantitative range (Picheral et al., 2010). Area under each curve is equal to one.

During the Green-Edge campaign, zooplankton was predominantly present in the top 50 to 100 m of the water column (Fig. 3B) (Trudnowska et al., 2021). In ice-covered and ice-breakup conditions, pellet-like particles exhibited peak abundance at this depth or slightly beneath it (Fig. 3B), thus further supporting the evidence that we successfully imaged freshly produced cylindrical fecal pellets. Additionally, the vertical distribution of pellet-like particles was distinct from that of all non-living particles (Fig. S3), potentially due to processes induced by zooplankton activity (egestion, sloppy feeding). While present in the same water mass, pellet-like particles did not appear to reach deeper waters. This agreed with the study by Durkin et al. (2021) in which the abundance of long fecal pellets attenuated rapidly with depth. The opacity and volume of pellet-like particles slightly increased with depth (Fig. S4A andS4B), especially in the 50–100 m layer where crustacean zooplankton were abundant (Fig. 3B). This might be the result of transformation processes (e.g. fragmentation, compaction) by zooplankton (Lampitt et al., 1990; Noji et al., 1991; Mayor et al., 2020), but it might also reflect a density gradient, with potentially denser particles as suggested by darker and larger morphologies having faster sinking rates. Similar mechanisms have already been observed further north in Baffin Bay (Sampei et al., 2004).
Pellet-like particles were most abundant during the ice-breakup period (Fig. 3B). Throughout the Green-Edge campaign, copepod distribution exhibited notable patchiness, yet showed a marked increase within the ice-breakup and ice-free zones (Rontani et al., 2022), potentially contributing to heightened cylindrical fecal pellet production. Furthermore, within the central bay region, copepods displayed increased opacity, likely due to enhanced gut visibility, probably resulting from their fullness (Vilgrain et al., 2021). It is plausible that copepods actively foraged on the recent diatom bloom, consequently amplifying cylindrical fecal pellet production. This could explain the significant positive correlation between the abundances of the pellet-like particles and the crustacean zooplankton in 0–100 m (Pearson’s correlation coefficient = 0.27, P = 0.028). Nonetheless, this requires validation through the examination of in situ images of small copepod fecal pellets (Fig. 5).
Using in situ imaging to observe the distribution of fecal pellets and the distribution of large zooplankton simultaneously would have been ideal in providing confidence about the identity of fecal pellet-like particles. However, we encountered two major limitations.
On one hand, it is possible that we missed much larger fecal pellets, since they tend to sink vertically and the UVP5 takes images above the particles, making them appear smaller or less elongated in the images. Considering that pellet-like particles from the three clusters were mostly produced by large crustacean zooplankton (e.g. euphausiids, mysids, amphipods), current sampling methods, including the UVP5, do not allow for accurate quantitative sampling of crustacean macrozooplankton communities (Ohman, 1988; McQuinn et al., 2015). As a result, the quantification process becomes slightly arbitrary and may not accurately reflect their true distribution. This may also explain the absence of a correlation between abundances of crustacean zooplankton and fecal pellets in 0–100 m of ice-covered and ice-free conditions. Concerted efforts are therefore needed to improve this methodology and enhance its accuracy.
On the other hand, since copepods dominate the zooplankton community in the Arctic Ocean (Longhurst, 1985; Vilgrain et al., 2021; Drago et al., 2022), it would have been interesting to image and study the fecal pellets they produce. However, as shown here, the UVP5 likely captures only the largest fecal pellets produced by the largest copepods (length > 1.20 mm). Its limited size range prevents the imaging of the smallest fecal pellets, usually measuring less than one mm (Fig. 5, Table S2). A new instrument with much higher resolution would be very promising for extending this methodology to the study of fecal pellets produced by copepods in the Arctic Ocean and in other oceanic regions.
This study lays the foundation for calculating elongated cylindrical fecal pellet carbon fluxes from in situ images. Thanks to the size-related descriptors that can be rapidly acquired from in situ images (Fig. S5A), it is possible to compute their volume using the most approximating shape, in this case a cylinder (Fig. S5B). Particle dimensions can be used to derive sinking speed, for example, using a modified Stokes equation as suggested by Komar et al. (1981) (Fig. S5B). While sinking speed estimates tend to be overestimated in the laboratory (Lampitt et al., 1990), in situ imaging could help predict them with greater accuracy. In situ particle imaging sampling permits the rapid and semi-automatic acquisition of morphological descriptors (opacity, size, shape…) that considerably influence the sinking speed of fecal pellets (Frangoulis et al., 2004). Next, carbon content of fecal pellets can be derived using conversion factors from the literature (Fig. S5C, Table S3). One possibility would be to take advantage of the transparency-related descriptors to quantify the porosity or density of individual particles, assuming that less transparent particles are denser (Fig. S5C, see Supp. Figure 3 in Flintrop et al., 2023). This would enable the adoption of a particle-centred approach and, therefore limit the approximations made. Finally, carbon flux could be derived from the carbon content and sinking speed of each particle (Fig. S5D). An example of the vertical distribution of pellet-like particles at station 075 is shown (Fig. S5E), identifying darker and larger particles that will likely contribute more to carbon flux than more transparent and smaller ones. Carbon fluxes can be computed at different depths using the sampling depths of particles. However, converting morphological information and carbon content from images into flux estimates is not straightforward (Giering et al., 2020). Further studies should be conducted to refine the relationships between carbon content and transparency-related descriptors, as well as between shape and sinking speed. Given the huge number of images of non-living particles covering the global ocean, this would be particularly important and could help better understand the role of pellet-like particles in carbon flux.
ACKNOWLEDGEMENTS
The GreenEdge project was conducted under the scientific coordination of the CERC program and of the CNRS & Université Laval Takuvik Joint International Laboratory (UMI3376). This work is a contribution to the scientific program of Québec Océan. We thank officers and crew of CCGS Amundsen, the Amundsen Science Data team and all other scientists and technicians who contributed to fieldwork. The authors also thank Jean-Olivier Irisson for his help on the preliminary work done on this dataset, Marcel Babin for providing data from the GreenEdge campaign, and Stéphane Plourde for his involvement in the copepods incubations as well as Patrick Pata for his careful proofreading. Finally, we thank two anonymous reviewers for their constructive comments on a previous version of the manuscript.
FUNDING
The work was supported by the Institut des Sciences du Calcul et des Données of Sorbonne University [IDEX SUPER 11-IDEX-0004] through the support of the sponsored project-team FORMAL (From ObseRving to Modeling oceAn Life) and a PhD grant to MP. The work was supported by the French Agence Nationale de la Recherche (ANR) [ANR-22-CE02–0023-1 project TRAITZOO] and by the Institut Universitaire de France [ZOOTRAIT project]. LV was financially supported by the Nunatsiavut Government. A CC-BY public copyright license has been applied by the authors to the present document and will be applied to all subsequent versions up to the Author Accepted Manuscript arising from this submission, in accordance with the grant’s open access conditions.
AUTHOR CONTRIBUTIONS
M.Pe., L.V., F.M. and S.-D.A. designed the study. G.P., C.L. And M.Pi. acquired data. M.Pe. performed the analyses and the literature research. M. Pe. wrote the manuscript with the help of all the co-authors. All the co-authors approuved the submitted and revised versions of the manuscript.
DATA AVAILABILITY
Data from the Green Edge campaign are available on Seanoe website (https://doi.org/10.17882/86417). Individual particles images, their metadata and their morphological descriptors are stored in the EcoTaxa web application (https://ecotaxa.obs-vlfr.fr/; project “UVP5hd GreenEdge 2016 [149]”). All codes and raw data (except images) are available on GitHub (https://github.com/margauxperhirin/faecalparticles).
REFERENCES
Komar, P. D., Morse, A. P., Small, L. F. and Fowler, S. W. (
Steinberg, D. K., Stamieszkin, K., Maas, A. E., Durkin, C. A., Passow, U., Estapa, M. L., Omand, M. M., McDonnell, A. M. P. et al. (