 https://orcid.org/0000-0002-8453-0812
Abstract
Nighttime environmental noise (EN) exposure disturbs sleep and increases morbidity and mortality. Affordable and effective countermeasures are needed, but rigorous research is scarce. This study investigates the efficacy of pink noise (PN) and earplugs for mitigating the effects of intermittent EN on sleep.
Twenty-five healthy adults (mean ± SD age 28.5 ± 5.9 years, seven male) participated in a seven-night polysomnographic laboratory study with different noise conditions including exposure to EN (93 events; maximum sound pressure level 45 to 65 dBA), PN (40 or 50 dBA), earplugs, and their combination. In the morning, participants completed cognitive tests, cardiovascular measurements, hearing tests, and surveys.
Compared to a noise-free control night, EN reduced N3 deep sleep (p < .0001) while PN reduced REM sleep (p < .001). Adding PN to EN worsened sleep structure, despite minor dose-dependent improvements of EN-induced sleep fragmentation and N3 sleep increases. Earplugs mitigated nearly all EN effects on sleep but started failing at the highest EN level (65 dBA). Morning cognition, cardiovascular measures, and hearing were not affected by nighttime noise, but subjective assessments of sleep, alertness and mood were significantly worse after EN and PN exposure.
In contrast to PN, earplugs proved efficacious in mitigating the effects of EN on sleep. Considering the importance of REM sleep for memory, emotion regulation, and neurodevelopment, the negative effects of PN on REM sleep caution against the widespread and indiscriminate use of broadband noise (BN). Additional research on optimal BN color/level and long-term use is needed, especially in vulnerable populations.
Registered at clinicaltrials.gov under “Broadband Sound and Sleep”; https://clinicaltrials.gov/study/NCT05774977; registration # NCT05774977.

Introduction
The World Health Organization (WHO) recommends that nighttime traffic noise levels do not exceed 40-45 dB to prevent adverse effects on sleep [1]. According to a recent analysis by the European Environment Agency, more than 72 Million people (or 16% of the population) are exposed to long-term nighttime traffic noise levels ≥50 dB and ~4.6 million Europeans experience severe sleep disturbances due to long-term exposure to traffic noise [2], with similar exposures in the United States [3]. Countless studies with both subjective and objective assessments of sleep have unequivocally shown that exposure to traffic noise disturbs sleep and impairs sleep recuperation [4, 5]. At the same time, numerous epidemiological studies have demonstrated associations between environmental noise (EN) exposure and various long-term health consequences [6–9], including cardiometabolic disease, which have also been linked to short, low-quality, or irregular sleep [10, 11].
Recent animal studies suggest that intermittent noise exposure during the rest period is key for the pathophysiological changes that underlie negative health consequences, while exposure during the active period or continuous noise exposure induce no or relatively modest effects [12]. The observed changes include vascular/brain infiltration with inflammatory cells, oxidative stress-induced vascular and brain damage, uncoupling of endothelial and neuronal nitric oxide synthase, and circadian rhythm changes [13]. In humans, traffic noise-induced endothelial dysfunction has been observed [14, 15], and aircraft noise has been shown to trigger acute cardiac events during sleep, representing additional pathways through which noise exposure contributes to cardiovascular mortality [16]. These changes provide biologic plausibility for the results of observational studies that link noise exposure to impaired health.
While sound insulation of windows and building structures can be effective in lowering noise levels in the bedroom, these countermeasures are expensive, and, in the case of aircraft noise, only residents living close to the airport are eligible for insulation measure reimbursement by the airport. Also, windows need to stay closed for the sound insulation to be effective, which adversely affects bedroom air quality [17]. Thus, affordable and effective countermeasures are needed to protect the population against the negative health consequences associated with traffic noise exposure. Two such potential countermeasures are sound masking using broadband noise (BN) and sound attenuation using earplugs.
BN, defined as noise whose power spectral density consists of a broad range of frequencies, could be an effective and inexpensive non-pharmacological intervention to mitigate some of the detrimental effects of traffic noise on sleep. Prominent examples of BN include white noise (WN) and pink noise (PN), but also sounds produced by home appliances (e.g. fans or air conditioning units) or nature sounds (e.g. ocean or rain sounds).
There are several hypotheses why BN could promote sleep [18]. First and foremost, BN can “mask” other sounds intruding into the bedroom and therefore lessen their potential to disturb sleep. Masking refers to the process by which the threshold for perceiving one sound is raised by another masking sound. Second, BN itself could have sleep promoting properties [19]. Third, turning on and being exposed to BN while in bed could become part of a sleep ritual and cue sleep [20]. However, there are also potential concerns regarding the use of BN during sleep; BN could disturb sleep and reduce sleep quality. Also, while the masking effect of BN is desirable for many sounds, it is unwanted and potentially dangerous for other sounds (e.g. a fire alarm or a crying baby). Finally, BN could cause hearing loss or more complex changes in the way sounds are processed if used over longer periods, even at sound levels much lower than considered problematic in occupational contexts [21]. This is especially important as WN machines have been found to regularly exceed occupational health thresholds [22, 23]. Hearing is an active process that consumes energy and produces metabolic waste. Similar to the brain during sleep [24], low sound levels during the night likely facilitate clearance of waste products from the cochlear organ, and BN may interfere with this process.
In 2021, this research group performed a systematic review of the literature on noise as a sleep aid [18]. The review identified 38 articles that were heterogenous in terms of noise exposure, population investigated, sleep assessments, and the type of intervention, including multiple simultaneous interventions. For many studies, sample sizes were small, and sleep assessments were subjective. Unsurprisingly, there was large variability in research findings, and the quality of the evidence was assessed to be very low according to GRADE criteria [25], a finding confirmed by a more recent review [26].
The lack of evidence for the efficacy of BN and the lack of studies addressing potential health consequences of long-term BN use are in stark contrast to the widespread use of BN during sleep across age groups, including in newborns and toddlers [22]. Although it is hard to find solid statistics on the use of BN during sleep, the top five search results for “white noise” on Apple’s app store have received more than 1 Million reviews. The top 5 videos on YouTube to the prompt “white noise” have been watched more than 700 Million times, and the top 5 bestsellers in the category “white noise machines” have received more than 100 000 reviews on Amazon.com (all searches performed on July 15, 2025). Finally, according to a 2023 Bloomberg document, white noise and ambient podcasts accounted for 3 million daily consumption hours on the Spotify platform [27].
While these applications and sounds may not exclusively be used during sleep, the ubiquitous use of BN warrants a closer and systematic investigation of its effects on sleep, hearing, physiological changes, and cognitive performance, especially in scenarios where sleep is disturbed by EN, as masking is one of the proposed mechanisms by which BN can promote sleep.
Earplugs are arguably the easiest and most affordable countermeasure against noise exposure. They attenuate sound pressure levels arriving at the tympanic membrane. Sound attenuation varies by sound frequency depending on the type of earplug. Earplugs have most often been investigated as countermeasures in hospital environments, especially in intensive care units, where EN is a common problem. However, evidence of their efficacy is mixed. While one recent meta-analysis found mostly positive effects of earplug use on subjectively and objectively assessed sleep quality [28], two different meta-analyses found no convincing evidence for a benefit of earplugs on sleep in hospital settings [29, 30]. Also, earplug wear comfort can be problematic and decrease adherence [31–33]. There is a need for controlled studies that investigate if, and to what extent, earplugs protect against the negative effects of EN on sleep.
To address the knowledge gaps outlined above, we performed a randomized, controlled, cross-over, polysomnographic sleep laboratory study in which we investigated the ability of PN and earplugs to mitigate some of the sleep disturbing effects of EN. The study also included a PN only condition to investigate sleep promoting and sleep disturbing properties of PN.
Materials and Methods
Participants
Participants had to be healthy, between 21 and 50 years old, non-smokers, non-excessive caffeine users, with a body mass index <35 kg/m2, drug-free, not pregnant, without sleep disorders or relevant hearing loss (> 25 dB HL in any frequency band up to 8 kHz), and naïve to broadband sound use during the night (see Supplement for a detailed list of study eligibility criteria). Participants were recruited through university email lists, flyers, and a professional service that solicits participants via social media posts. Upon expressing interest in participation, all respondents were initially screened via telephone. Following the telephone screening, participants completed up to two in-person screening sessions that included medical history, surveys, blood draw, electrocardiogram, tympanometry, hearing test, and overnight pulse oximetry to assess eligibility (see Table S1 for reasons for ineligibility). Participants also could not be working night, swing, split or rotating shifts, and they could not have planned travel across more than one time zone one month prior to the study. Subjects wore a wrist-worn actigraph (Actigraph gt3x+, the Actigraph, Pensacola, FL) continuously after the first screening until the last day of the study. They also filled out a daily sleep log starting after first screening until the start of the study. Twenty-seven participants were enrolled. Two participants withdrew after study nights two and three, respectively, and did not contribute to data analysis. One participant of study group 5 withdrew after study night five and was included in data analysis. Thus, 25 participants (mean age ± standard deviation 28.5 ± 5.9 years, range 21–41 years; seven male; 36% white; 28% Asian; 36% other race/ethnicity) contributed to data analysis. In these participants, bedtime prior to the study was reported between 10 p.m. and 12 a.m. in 62% of sleep log entries and wake-up time was reported between 6 a.m. and 8 a.m. in 67% of entries, i.e. within ±1 hour of scheduled lights out and lights on (see below). Eighty percent of study participants were classified as intermediate types and 20% as moderate morning types on the Morningness–Eveningness Questionnaire [34].
The study protocol was approved by the Institutional Review Board of the University of Pennsylvania and participants provided written informed consent prior to the first screening. The study was registered at clinicaltrials.gov under protocol # NCT05774977.
Study protocol
This was a 7-night sleep laboratory study performed at the Chronobiology and Isolation Laboratory (CIL) in the Hospital of the University of Pennsylvania between November 2023 and June 2024. The CIL is a sleep laboratory with four separate bedrooms that are acoustically isolated from each other (see Supplement and Figures S1 and S2). Temperature was maintained at 73°F (22.8°C) throughout the study. The study started on a Monday evening and ended on the following Monday morning. Participants were studied in groups of up to four. They arrived at the lab around 7 p.m., had dinner, performed cognitive tests and cardiovascular measurements, filled out surveys, were instrumented for polysomnography (PSG), and then went to bed. Planned lights out was 11 p.m., and lights were turned on exactly 8 hours after lights out.
While it was not possible to fully blind subjects in the sense that they could perceive EN and/or PN after lights out, neither participants nor study staff were aware of the sequence of noise conditions. Study staff only learned about the condition of the specific study night when they started noise event playback after lights out, as they had to monitor correct playback throughout the night. In the morning, participants filled out surveys, performed cognitive tests and cardiovascular measurements, before they were allowed to shower, have breakfast, and leave the lab to pursue their normal daily activities and return to the lab in the evening for the next study night. Psychomotor vigilance test performance was checked in the morning to make sure participants were sufficiently alert to leave the lab. Participants were also offered a taxi or rideshare at no cost to them. They were not allowed to nap, exercise, or drink alcohol during the day. They were not allowed to consume caffeinated beverages after 3 p.m.
Exposure conditions and hypotheses
After a noise-free adaptation night, participants experienced a sequence of the following six conditions (LA,eq refers to the average noise level across the 8-hour period; all dB values in this manuscript refer to A-weighted dB values unless otherwise noted):
CTRL: Control night without any noise exposure (LA,eq = 23.7 dB)
EN: Environmental noise only (LA,eq = 43.2 dB)
PN50: Pink noise at 50 dB only (LA,eq = 50.0 dB)
EN + PN40: Environmental noise plus PN at 40 dB (LA,eq = 45.0 dB)
EN + PN50: Environmental noise plus PN at 50 dB (LA,eq = 50.9 dB)
EN + EP: Environmental noise plus participants wearing earplugs (LA,eq = 43.2 dB)
We chose PN over WN as a recent review suggested that PN may be more effective in promoting sleep [26]. PN levels were set based on listening tests performed in the sleep lab and in relation to single event maximum sound pressure levels (SPLs; see below). The research team felt that 50 dB would just be tolerated by participants naïve to continuous BN exposure. The second PN level was set to 40 dB as a reduction by 10 dB translates to a 10-fold reduction in sound energy and a perception of “half as loud”. The conditions for study groups 1 through 6 followed a randomized sequentially counterbalanced Latin square design [35] such that each condition appeared in every position (i.e. night) exactly once, and each condition was preceded by each other condition exactly once (see Table 1). Group 7 was a backup group. Its sequence was chosen in a way to optimally balance conditions across nights considering prior drop-outs. The PSG system failed in three out of four subjects in study night 2 of group 3. It was thus decided to replace the EN + EP night 6 with another CTRL night. In group 5, EN + PN50 was erroneously played back in night 5 instead of night 7, and PN50 was played back in night 7 instead of night 5.
Condition sequence
| Night 2 | Night 3 | Night 4 | Night 5 | Night 6 | Night 7 | |
|---|---|---|---|---|---|---|
| Group 1 | PN50 | EN + PN50 | CTRL | EN + PN40 | EN | EN + EP |
| Group 2 | EN + PN50 | EN + PN40 | PN50 | EN + EP | CTRL | EN |
| Group 3 | CTRL | PN50 | EN | EN + PN50 | EN + PN40 | |
| Group 4 | EN + PN40 | EN + EP | EN + PN50 | EN | PN50 | CTRL |
| Group 5 | EN | CTRL | EN + EP | EN + PN40 | ||
| Group 6 | EN + EP | EN | EN + PN40 | CTRL | EN + PN50 | PN50 |
| Group 7 | CTRL | EN + PN40 | EN | PN50 | EN + EP | EN + PN50 |
CTRL: Noise-free control night; EN: Environmental noise only; EN + PN40: Environmental noise plus constant pink noise at 40 dBA; EN + PN50: Environmental noise plus constant pink noise at 50 dBA; PN50: Constant pink noise at 50 dBA only; EN + EP: Environmental noise plus earplugs
Standard foam earplugs were provided in three sizes (Mack’s Slim Fit Soft, Mack’s Maximum Protection Soft, and Mack’s Ultra Soft; Mack’s, Warren, MI). Noise attenuation achieved by inserting earplugs was determined with the WAHTS system (see below) for each study participant and averaged 25.5 dB (SD 9.2 dB, range 10.8-41.6 dB).
The following hypotheses were tested with this study design:
EN disturbs sleep and reduces time spent in N3 sleep and Rapid Eye Movement (REM) sleep (EN vs. CTRL).
PN mitigates the negative effects of EN on sleep in a dose-dependent manner (EN + PN50 vs. EN + PN40 vs. EN).
Earplugs mitigate the negative effects of EN on sleep (EN + EP vs. EN).
Sleep structure is better after the PN night compared to the control night (PN50 vs. CTRL).
Noise exposure and event sequence
We selected nine traffic noise events (two jets, two helicopters, two drones, one low sonic boom, one car, one train) and two alarm sounds (one baby crying, one fire alarm; see Supplement, Table S2 and Figure S3). The two jets, the car and the train have previously been used in the AIRORA study [36]. A validated transfer function reflecting the frequency-dependent sound attenuation of a partially open window was applied to sounds recorded outdoors (drones, helicopters, low sonic boom). The modified sounds reflect perception in a bedroom. Noise event playback always started at the beginning of a full minute which coincided with the start of a 30-second sleep epoch. Noise events were played back at maximum SPLs (LAS,max) of 45, 55, and 65 dB. Thus, PN at 40 dB partially masked all environmental noise events (ENEs) in EN + PN40 nights, while PN at 50 dB fully masked ENEs with 45 dB LAS,max and partially masked ENEs with 55 dB or 65 dB LAS,max in EN + PN50 nights. Based on more than 38 000 noise events recorded in a recent field study on the effects of aircraft noise on sleep [37], 45 dB, 55 dB, and 65 dB LAS,max reflect the 62nd, 93rd, and 99th percentile of the distribution of maximum SPLs measured in the bedroom of residents living in the vicinity of 56 US airports. First noise-induced awakenings can typically be observed once maximum SPL exceeds 30-35 dB in the bedroom, and the WHO recommends that maximum SPLs do not exceed 45 dB in the bedroom [38]. Thus, maximum SPLs played back in this study were chosen to reflect the higher end of noise levels typically observed in the bedrooms of residents exposed to traffic noise.
Each noise event was played back at each maximum SPL three times for a total of nine times in nights that included EN. Each alarm sound was played back at each maximum SPL twice for a total of 6 times. Thus, a total of 9*9 + 2*6 = 93 noise events were played back in EN, EN + PN40, EN + PN50, and EN + EP nights. The number of ENEs was chosen based on an earlier study [36] with the goal to disturb sleep relevantly while avoiding participant drop-outs due to excessive noise exposure.
PN playback started at lights out and was continuously played back throughout the 8-hour time in bed period, while noise event playback started 15 minutes after lights out. Traffic noise events were spaced 4, 5, or 6 minutes apart decreasing predictability of noise playback (alarm sounds were always preceded by a 5-minute interval). The sequence of noise events and alarm sounds, maximum SPLs, and noise-free pauses was randomized but balanced, assuring that event types, maximum SPLs, and noise-free intervals were evenly distributed across the night (see Supplement for details). The noise event sequence was identical across nights within a study group but changed across study groups.
PN was played back over ceiling speakers (JBL Control 47LP) and EN via active studio monitors (Neumann KH 310 A). Prior to each study run, each of the four bedrooms was acoustically calibrated with a PN generator and a class-1 sound level meter (NTI Audio XL2) placed approximately in the position of the sleeper’s head. Sounds were recorded in each bedroom on every study night to verify correct sound playback. The background noise level in the bedrooms was ~24 dB.
Polysomnography
Overnight PSG (F3-A2, F4-A2, EOG-L, EOG-R, and EMG) was performed with the Cerebra Prodigy 2 system (Cerebra Health, Winnipeg, Canada). Supervised automatic sleep scoring was performed by the Siesta Group (Vienna, Austria) with their Somnolyzer platform which received the autoscoring certificate by the American Academy of Sleep Medicine. In addition to discrete sleep stages, the system also provides hypnodensities, i.e. the probability of each sleep stage being assigned to a given epoch [39], which were used in some of the analyses described below. The odds ratio product (ORP) is a continuous measure of sleep depth scored in 3-second epochs [40, 41] that ranges from 0 (maximum sleep depth) to 2.5 (fully awake) and was used as a secondary sleep outcome. ORP scores were provided by Cerebra Health.
Participants also wore a FAROS heart rate and movement monitor (Bittium, Oulu, Finland) during the night, which was attached with two electrodes to the participant’s chest and measured the electrocardiogram (ECG; derivation Eindhoven II) at 1 kHz and body movements in three axes at 25 Hz (set to 2 g dynamic range). The Siesta Group used a validated cardiorespiratory sleep staging algorithm (CReSS) [42] to score sleep stages from FAROS data. PSG sleep stages missing due to low signal quality or signal loss were imputed with CReSS sleep stages after synchronizing both data streams using ECG artifacts in the EEG. Analyses based on periods without signal loss indicate substantial agreement between the two methods (Cohen’s kappa of 0.70 and 81.2% agreement). On average, 5.5% (SD 15.8%) of data were imputed this way (101 out of 144 nights did not require imputation; see Supplement Table S21 for degree of imputation by condition). The CReSS algorithm combines stage N1 and N2 as light sleep. For imputation purposes, light sleep was imputed as N2. Twelve nights with >20% missing PSG data were not used for calculating EEG arousal-related outcomes, hypnodensity-related outcomes and ORP-related outcomes.
Surveys
Surveys were completed, always in the same order, in the evening after rotating through cognitive tests and cardiovascular measurements and in the morning immediately after waking up. The evening survey (see Supplement) contained questions about actigraph off-wrist periods; exercise, alcohol use, caffeine use, and medication use during the day; daytime stress; assessments of tiredness and tension; the short form of the Positive and Negative Affect Scale (PANAS-SF) [43], and the short-form of the Profile of Moods Scale (POMS-SF) [44]. The morning survey (see Supplement) contained questions about sleep latency; nocturnal wake periods; assessments of tiredness, tension, difficulty falling asleep, sleeping better or worse than usual, sleep depth, wake up frequency, sleep quality [45]; the PANAS-SF and POMS-SF. It also had questions about PN, EN, and earplugs and their effects on sleep.
Cardiovascular and cognitive measures
All cardiovascular and cognitive measures were performed in the evening (before PSG instrumentation) and in the morning (after survey completion) in a subject’s bedroom. As only one driving simulator and one hearing test device were available, participants rotated through stations. Each participant rotated through tests and measurements in the same order across all study days and the order in which tests and measurements were taken was changed for each bedroom with each study run. The analyses presented in this manuscript concentrate on tests and measurements taken in the morning.
After sitting still at a table for five minutes, three consecutive automatic blood pressure measurements were taken with 1-minute intervals between measurements (Omron Series 10 Upper Arm Blood Pressure Monitor). Cuff-size was adjusted based on upper arm circumference. The average for systolic and diastolic blood pressure across the three measurements was used for data analysis. Immediately after blood pressure measurements, a 5-minute resting ECG was recorded with the FAROS device. The Kubios HRV Scientific software (Kubios, Kuopio, Finland; version 3.4.3) was used to estimate heart rate variability metrics from the ECG after manual artifact identification and correction.
A pure-tone audiometry checking frequencies between 500 Hz and 16 kHz was performed with a calibrated WAHTS system (WAHTS Hearing LLC, Lebanon, NH). If the algorithm failed to converge at a certain frequency, the highest hearing loss value measured in the same subject at that frequency was imputed.
Participants performed the computerized Cognition test battery on Dell Precision 7560 laptops (15.6-inch display with 1920x1080 resolution). Cognition consists of 10 brief tests that cover a range of cognitive domains with known cerebral representation (Motor Praxis, Visual Object Learning, Fractal 2-Back, Abstract Matching, Line Orientation, Emotion Recognition, Matrix Reasoning, Digit-Symbol Substitution, Balloon Analog Risk, Psychomotor Vigilance; see Supplement and Figure S4) [46]. Prior to data analysis, test scores were adjusted for practice and stimulus set effects [47], and z-transformed based on average and standard deviation for each task across all tests taken. Accuracy and speed across cognitive domains were calculated by averaging z-scores across the 10 tests as described elsewhere (risk taking on the Balloon Analog Risk Task did not contribute to the overall accuracy score) [48]. Accuracy and speed scores were averaged to calculate an efficiency metric.
Participants performed a ~7-minute divided attention task on an STISIM Drive Model M300WS driving simulator (STISIM Drive, Hawthorne, CA). They had to maintain a constant speed of 55 mph and stay in a highway lane with several bends and oncoming traffic. At random intervals, an indicator light would appear close to the left- or right-side mirror, and participants had to press a button situated to the left or right of the steering wheel as soon as they saw the indicator light.
Statistical analysis
The primary outcome of the study was time spent in N3 plus REM sleep during an 8-hour sleep opportunity (11 p.m. – 7 a.m.). All power calculations were conducted using PASS (Version 21 NCSS), assuming a 5% type-I error rate and using two-sided hypothesis tests. Data collected in a previous study on the effects of traffic noise on sleep [36] were used to inform power calculations. Power calculations indicated that, with a proposed sample size of 24 subjects, we had at least 80% power to detect a medium effect size of 0.60 for contrasting noise exposure nights with the control night in the primary outcome.
For statistical analyses, linear mixed-effect models with random intercept for subjects were used in SAS (SAS Institute, Carey, NC; version 9.4). The six study conditions were entered as a categorical variable. Study night was entered as a continuous variable to account for a time-in-study effect, as the balance of study conditions was not perfect (see Table 1). We did not include other covariates as the focus of all analyses was within-subject. p-values were adjusted for multiple testing with the false discovery rate method [49]. Unless otherwise mentioned, all p-values reported in the body of the manuscript reflect adjusted p-values. Pre-specified contrasts were calculated if the Type-III test of fixed effects indicated a significant difference (adjusted p < .05) between study conditions. For awakenings and arousals per hour total sleep time (TST) and for the ORP, additional analyses were run for periods with (noise) and without (quiet) noise event playback. For this analysis, any portion of a 30-second sleep epoch overlapping with noise event playback was considered a noise epoch. Across the 8-hour night, 156 epochs (16.3%) were classified as noise epochs. Finally, a linear mixed model with subject as random intercepts investigated the effect of study night (categorical variable; adjusting for noise condition) on time spent in stages wake, N1, N2, N3, and REM as well as average ORP levels across the night.
Two event-related analyses were performed. In the first analysis, sleep stage hypnodensities and ORP were calculated for the period one epoch before until 8 epochs after noise event onset to investigate how hypnodensities and ORP change in response to noise events across study conditions (separate models for each epoch). The period was restricted to 8 epochs or 4 minutes as the shortest interval between noise events was 4 minutes. The PN50 condition did not contribute to event-related analyses. Hypnodensity models were adjusted for LAS,max, noise event indicator, binary age (median split, median age = 27 years), sex, study night, elapsed sleep time, noise interval, and prior sleep stage. Marginal means were estimated, and the noise conditions were contrasted to CTRL, which served as sham in this analysis.
In the second analysis, average hypnodensities across a 4-minute period since noise event onset were estimated depending on noise event LAS,max. Models were adjusted for prevalence of the investigated sleep stage prior to noise onset, noise event indicator, binary age (median split), sex, study night, noise interval, and elapsed sleep time. Marginal means were estimated, and the noise conditions were contrasted to CTRL, which again served as sham in this analysis. Similar models were calculated for average ORP across the noise event duration (rounded to next full 3 seconds). This model was adjusted for average ORP in the 30-second period prior to noise event onset, noise event indicator, binary age (median split), sex, study night, noise interval, elapsed sleep time, and prior sleep stage. Event-related analyses were considered exploratory and p-values were not adjusted for multiple testing. Analyses by noise event type are beyond the scope of this manuscript and will be reported elsewhere.
For all models, marginal means were estimated with the obsmargins option in SAS, which uses coefficients proportional to the margins observed in the study. Effect sizes were calculated for sleep structure contrasts and are provided as z-scores.
Results
Sleep structure
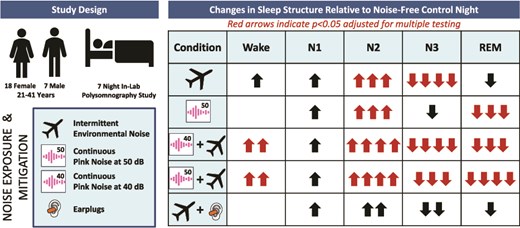
Mixed model results indicate significant differences (adjusted p < .05) between study conditions for 11 out of the 13 investigated sleep structure outcomes (Table 2). Only sleep period time and time spent in stage N1 did not differ between conditions. Based on post-hoc contrasts (Table 3), time spent in N3 and REM sleep (the primary study outcome) was significantly lower compared to CTRL for all conditions with EN exposure except EN + EP. Neither EN + PN40 nor EN + PN50 differed significantly from EN in the time spent in N3 and REM sleep, while participants spent 21.0 more minutes on average (z = 0.52, p = .0056) in N3 and REM sleep in EN + EP relative to EN nights.
Effects of environmental noise, pink noise, earplugs and their combination on sleep macrostructure
| CTRL | EN | EN + PN40 | EN + PN50 | PN50 | EN + EP | p | Adj. P | |
|---|---|---|---|---|---|---|---|---|
| Sleep Period Time [min] | 460.6 (455.5; 465.7) | 462.4 (457.3; 467.6) | 463.9 (458.7; 469.1) | 456.3 (451.1; 461.5) | 464.7 (459.5; 469.9) | 463.7 (458.3; 469.2) | .0589 | .0638 |
| Total Sleep Time [min] | 444.1 (435.7; 452.5) | 438.9 (430.4; 447.4) | 430.7 (422.0; 439.3) | 428.3 (419.6; 436.9) | 444.7 (436.0; 453.3) | 444.4 (435.2; 453.5) | .0031 | .0050 |
| Sleep Onset Latency [min] | 18.2 (13.2; 23.2) | 17.5 (12.4; 22.5) | 15.6 (10.5; 20.7) | 23.6 (18.5; 28.7) | 15.0 (9.8; 20.1) | 14.9 (9.5; 20.3) | .0300 | .0390 |
| REM Latency [min] | 91.1 (75.9; 106.2) | 92.8 (77.5; 108.2) | 106.8 (91.2; 122.3) | 117.9 (102.3; 133.5) | 102.8 (87.2; 118.3) | 92.9 (76.5; 109.4) | .0384 | .0454 |
| Wake [min] | 32.6 (24.4; 40.7) | 37.4 (29.1; 45.6) | 46.0 (37.6; 54.4) | 48.0 (39.6; 56.4) | 32.0 (23.6; 40.4) | 32.1 (23.3; 41.0) | .0019 | .0042 |
| N1 [min] | 32.3 (26.0; 38.6) | 37.2 (30.8; 43.6) | 38.6 (32.2; 45.0) | 40.6 (34.1; 47.0) | 35.7 (29.2; 42.1) | 34.7 (28.1; 41.4) | .0814 | .0814 |
| N2 [min] | 196.1 (184.2; 208.0) | 216.9 (204.9; 228.9) | 218.7 (206.6; 230.9) | 217.4 (205.2; 229.5) | 216.2 (204.1; 228.3) | 203.8 (191.2; 216.4) | .0005 | .0015 |
| N3 [min] | 101.0 (88.6; 113.4) | 77.6 (65.2; 90.0) | 79.8 (67.4; 92.3) | 85.3 (72.9; 97.8) | 96.5 (84.0; 109.0) | 94.5 (81.8; 107.2) | <.0001 | <.0001 |
| REM [min] | 118.1 (109.3; 126.9) | 111.0 (102.1; 119.8) | 96.6 (87.7; 105.6) | 89.1 (80.1; 98.0) | 99.5 (90.5; 108.4) | 114.9 (105.5; 124.2) | <.0001 | <.0001 |
| N3 and REM [min] | 219.1 (203.5; 234.7) | 188.6 (172.8; 204.3) | 176.5 (160.6; 192.3) | 174.3 (158.4; 190.1) | 196.0 (180.1; 211.8) | 209.5 (193.2; 225.8) | <.0001 | <.0001 |
| Sleep Efficiency [%] | 96.4 (94.9; 97.9) | 94.9 (93.4; 96.4) | 92.8 (91.3; 94.4) | 93.8 (92.3; 95.4) | 95.7 (94.1; 97.2) | 95.8 (94.2; 97.5) | .0017 | .0042 |
| WASO [min] | 17.7 (10.6; 24.9) | 23.7 (16.4; 30.9) | 33.8 (26.4; 41.1) | 28.1 (20.7; 35.4) | 20.4 (13.1; 27.8) | 20.7 (12.9; 28.4) | .0027 | .0049 |
| Awakening Duration [min] | 1.7 (1.26; 2.14) | 1.82 (1.38; 2.27) | 2.65 (2.19; 3.1) | 2.24 (1.79; 2.7) | 1.84 (1.39; 2.29) | 1.85 (1.37; 2.33) | .0089 | .0128 |
CTRL: Noise-free control night; EN: Environmental noise only; EN + PN40: Environmental noise plus constant pink noise at 40 dBA; EN + PN50: Environmental noise plus constant pink noise at 50 dBA; PN50: Constant pink noise at 50 dBA only; EN + EP: Environmental noise plus ear plugs; cell entries reflect estimate (95% confidence interval); P: Type-III tests of fixed effects p-value; Adj. P: p-value adjusted for multiple testing according to Benjamini and Hochberg [49]; Sleep Onset Latency defined as time until first sleep stage N2; REM latency calculated relative to lights out; Time spent in Wake, N1, N2, N3, and REM based on Time in Bed; Sleep Efficiency is based on Sleep Period Time
Post-hoc tests for the effects of environmental noise, pink noise, earplugs and their combination on sleep macrostructure (standardized estimates can be found in Supplementary Table S22)
| EN - CTRL | PN50 - CTRL | EN + PN40 - CTRL | EN + PN50 - CTRL | EN + EP - CTRL | EN + PN40 - EN | EN + PN50 - EN | EN + EP - EN | EN + PN50 - EN + PN40 | |
|---|---|---|---|---|---|---|---|---|---|
| Total Sleep Time [min] | −5.2 (5.1) | 0.6 (5.2) | −13.4 (5.2)* | −15.8 (5.2)* | 0.3 (5.4) | −8.2 (5.2) | −10.6 (5.2) | 5.5 (5.4) | −2.4 (5.3) |
| Sleep Onset Latency [min] | −0.8 (2.8) | −3.3 (2.8) | −2.6 (2.8) | 5.4 (2.8) | −3.3 (2.9) | −1.9 (2.8) | 6.2 (2.9) | −2.5 (3.0) | 8.0 (2.9) |
| REM Latency [min] | 1.8 (9.2) | 11.7 (9.3) | 15.7 (9.3) | 26.8 (9.3)* | 1.9 (9.7) | 13.9 (9.4) | 25.0 (9.4)* | 0.1 (9.8) | 11.1 (9.5) |
| Wake [min] | 4.8 (4.9) | −0.6 (5.0) | 13.5 (5.0)* | 15.4 (5.0)* | −0.4 (5.2) | 8.6 (5.0) | 10.6 (5.0) | −5.2 (5.2) | 2.0 (5.1) |
| N2 [min] | 20.8 (5.9)** | 20.1 (6.0)** | 22.7 (6.0)** | 21.3 (6.0)** | 7.7 (6.2) | 1.9 (6.0) | 0.5 (6.0) | −13.1 (6.3) | −1.4 (6.1) |
| N3 [min] | −23.4 (4.0)**** | −4.5 (4.0) | −21.2 (4.0)**** | −15.7 (4.0)*** | −6.5 (4.2) | 2.2 (4.1) | 7.7 (4.1) | 16.9 (4.2)*** | 5.5 (4.1) |
| REM [min] | −7.1 (4.6) | −18.6 (4.7)*** | −21.5 (4.7)**** | −29.0 (4.7)**** | −3.2 (4.9) | −14.3 (4.7)** | −21.9 (4.7)**** | 3.9 (4.9) | −7.6 (4.8) |
| N3 and REM [min] | −30.5 (6.5)**** | −23.1 (6.6)** | −42.6 (6.6)**** | −44.8 (6.6)**** | −9.6 (6.9) | −12.1 (6.7) | −14.3 (6.7) | 21.0 (6.9)** | −2.2 (6.8) |
| Sleep Efficiency [%] | −1.5 (0.9) | −0.7 (0.9) | −3.6 (0.9)** | −2.6 (0.9)* | −0.6 (1.0) | −2.0 (0.9) | −1.0 (0.9) | 1.0 (1.0) | 1.0 (0.9) |
| WASO [min] | 5.9 (4.1) | 2.7 (4.2) | 16.1 (4.2)** | 10.3 (4.2) | 2.9 (4.4) | 10.1 (4.2) | 4.4 (4.2) | −3.0 (4.4) | −5.7 (4.3) |
| Awakening Duration [min] | 0.13 (0.27) | 0.14 (0.28) | 0.95 (0.28)** | 0.55 (0.28) | 0.15 (0.29) | 0.82 (0.28)* | 0.42 (0.28) | 0.03 (0.29) | −0.4 (0.28) |
CTRL: Noise-free control night; EN: Environmental noise only; EN + PN40: Environmental noise plus constant pink noise at 40 dBA; EN + PN50: Environmental noise plus constant pink noise at 50 dBA; PN50: Constant pink noise at 50 dBA only; EN + EP: Environmental noise plus ear plugs; cell entries reflect estimate (standard error); p-values were adjusted for multiple testing (n = 9) according to Benjamini and Hochberg [49] and are coded as:
*adj. p < .05.
**adj. p < .01.
***adj. p < .001.
****adj. p < .0001.
Numerical unadjusted and adjusted p-values can be found in Supplementary Tables S15 and S16; Sleep Onset Latency defined as time until first sleep stage N2; REM latency calculated relative to lights out; Time spent in Wake, N2, N3, and REM based on Time in Bed; Sleep Efficiency is based on Sleep Period Time
EN was associated with a 23.4 minutes mean decrease in stage N3 (z = -0.82, p < .0001) relative to CTRL which was largely exchanged for the more superficial sleep stage N2 (+20.8 min, z = 0.74, p = .0018; Figure 1). None of the other sleep structure variables differed significantly between EN and CTRL.

Planned post-hoc contrasts for the effects of environmental noise, PN, and wearing earplugs on changes in sleep macrostructure. CTRL: Noise-free control night; EN: Environmental noise only; PN50: Constant pink noise at 50 dBA only; EN + PN40: Environmental noise plus constant PN at 40 dBA; EN + PN50: Environmental noise plus constant PN at 50 dBA; EN + EP: Environmental noise plus earplugs; sleep stages are abbreviated as W: Wake; 1: N1; 2: N2; 3: N3; R: REM. Error bars reflect unadjusted 95% confidence intervals. Asterisks reflect p-values adjusted for multiple comparisons [49]: *p < .05; **p < .01; ***p < .001; ****p < .0001; see Table 3 for estimates.

PN50 was associated with an 18.6 minutes mean decrease in REM sleep (z = -0.79, p = .0003) relative to CTRL which was again largely exchanged for the more superficial sleep stage N2 (+20.1 min, z = 0.72, p = .0022). None of the other sleep structure variables differed significantly between PN50 and CTRL.
EN + PN40 and EN + PN50 nights were associated with significantly (p < .05) less time spent in stage N3 and in REM sleep, more time spent in stage N2 and awake, shorter TST, lower sleep efficiency, more wake after sleep onset (WASO; EN + PN40 only) and longer awakening duration (EN + PN40 only) compared to CTRL. Compared to EN, both EN + PN40 and EN + PN50 were associated with significantly less REM sleep, while REM latency was significantly increased for EN + PN50 only. Also, time spent awake was longer in both EN + PN40 (+8.6 min, z = 0.39) and EN + PN50 (+10.6 min, z = 0.48) nights relative to EN nights, albeit statistically non-significantly (Table 3). There was a tendency for more stage N3 (+5.5 min, z = 0.16) and less REM sleep (-7.6 min, z = -0.32) in EN + PN50 relative to EN + PN40 nights, but these differences were small and not statistically significant.
There were no significant differences in sleep structure between EN + EP and CTRL. Furthermore, more than 70% of the reduction in stage N3 in EN nights was recovered by wearing earplugs (+16.9 min, z = 0.59; p = .0003).
A model investigating the effect of study night (categorical; adjusting for study condition) on time spent in the different sleep stages and on ORP only found a significant effect of study night for REM sleep (Type-III test of fixed effects p = .0021; wake: p = .3694; N1: p = .5048; N2: p = .3694; N3: p = .2873; ORP: 0.0597). REM sleep duration was shortest in study night 2 and increased across study nights (estimated marginal means for REM sleep duration were (mean ± SE): night 2: 91.9 ± 4.7 min; night 3: 103.6 ± 4.4 min; night 4: 102.6 ± 4.4 min; night 5: 110.9 ± 4.4 min; night 6: 110.3 ± 4.5 min; night 7: 108.4 ± 4.5 min).
Sleep fragmentation and ORP
Mixed model results indicate significant differences (adjusted p < .05) between study conditions for all investigated sleep fragmentation indicators except for EEG arousal frequency during quiet periods (Figure 2; Table S3; sleep stage specific changes in ORP can be found in Table S4).

Effects of environmental noise, PN, and wearing earplugs on changes in sleep continuity (awakening and arousal frequency) and sleep depth (odds ratio product [ORP]) depending on whether EN was (noise periods) or was not (quiet periods) played back during a given sleep epoch. CTRL: Noise-free control night; EN: Environmental noise only; PN50: Constant pink noise at 50 dBA only; EN + PN40: Environmental noise plus constant PN at 40 dBA; EN + PN50: Environmental noise plus constant PN at 50 dBA; EN + EP: Environmental noise plus earplugs. Error bars reflect unadjusted 95% confidence intervals. Asterisks reflect p-values adjusted for multiple comparisons [49]: *p < .05; **p < .01; ***p < .001; ****p < .0001; see Table S3 and S5 for additional details; sleep stage-specific ORP analyses can be found in Table S10.

Post-hoc tests show that awakening frequency, EEG arousal frequency, and ORP were all strongly and significantly increased during noise event playback in EN, EN + PN40, and EN + PN50 nights relative to CTRL (Table S5). There was a tendency of EN + PN40 and EN + PN50 to mitigate some of the effects of EN on sleep fragmentation in a dose-dependent manner, with significantly fewer awakenings in EN + PN50 compared to EN + PN40 nights (-1.68 per h TST, z = -0.70, p = .0172). While awakening and EEG arousal frequency did not differ in quiet periods for EN, EN + PN40, and EN + PN50 nights relative to CTRL, ORP was significantly higher in EN, EN + PN40, and EN + PN50 nights relative to CTRL. Viewed across the whole night, awakening frequency did not differ for EN, EN + PN40, and EN + PN50 nights relative to CTRL, while both EEG arousal frequency and ORP were significantly higher for EN, EN + PN40, and EN + PN50 nights relative to CTRL, with no significant differences between EN, EN + PN40, and EN + PN50 nights (Table S5).
None of the sleep fragmentation indicators differed significantly between EN + EP and CTRL nights (Table S5), suggesting near full mitigation of the effects of EN on sleep fragmentation. EN + EP nights were associated with significantly lower awakening and EEG arousal frequencies as well as lower ORP during noise periods relative to EN nights. ORP was also significantly lower during quiet periods and the whole night for EN + EP compared to EN nights.
Event-related analyses
Tracking hypnodensities for a 4-minute period since noise onset showed a significant increase in wake probability for the EN condition for the first minute followed by a subsequent decline which was no longer different from CTRL >2 minutes after noise onset (Figure 3, A). The increase in wake probability during the first minute after noise event onset was slightly lower for EN + PN50. However, the decline in wake probability >2 minutes after noise onset was slower for both EN + PN40 and EN + PN50 relative to EN, and wake probabilities were still significantly higher at the end of the 4-minute window.
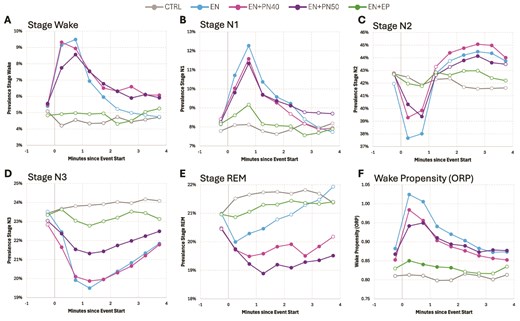
Changes in sleep stage prevalence (hypnodensity; panels A-E) and ORP (odds ratio product; panel F) for a period from 30 seconds prior to noise event onset to 4 minutes after noise event onset. CTRL: Noise-free control night; EN: Environmental noise only; EN + PN40: Environmental noise plus constant PN at 40 dBA; EN + PN50: Environmental noise plus constant PN at 50 dBA; EN + EP: Environmental noise plus earplugs. Open circles reflect no statistically significant difference to CTRL (unadjusted p ≥ .05) while closed circles reflect a statistically significant difference to CTRL (unadjusted p < .05) for a given 30-second sleep epoch.

Stage N1 probability increased for EN in the first minute and then declined (Figure 3, B). It was indistinguishable from CTRL >2.5 minutes since noise event onset. EN + PN40 and EN + PN50 showed similar patterns compared to EN.
Stage N2 probability decreased during the first 30 sec and then increased and rebounded beyond pre-noise event levels, with significantly higher N2 probabilities compared to CTRL >2.5 minutes after noise onset (Figure 3, C). EN + PN40 and EN + PN50 showed a similar pattern with a slightly lower decline in N2 probability in the first minute after noise onset.
Stage N3 probability declined for the first 1.5 minutes after noise onset in the EN condition and then recovered slowly but remained significantly lower compared to CTRL at the end of the 4-minute observation window (Figure 3, D). N3 probability for EN + PN40 mimicked that of EN, while the drop in N3 probability was less steep for EN + PN50. N3 probability was still lower at the end of the 4-minutes window for EN + PN50 compared to CTRL, but it was higher compared to both EN and EN + PN40.
REM probability decreased during the first 30 sec of noise event playback and then increased steadily in EN nights compared to CTRL (Figure 3, E). It was no longer statistically different from CTRL >1.5 minutes after noise onset. The drop in REM probability was more pronounced for EN + PN40 and especially EN + PN50, and the recovery was also slower. At the end of the 4-minute window, REM probability was still significantly lower compared to CTRL for both EN + PN40 and EN + PN50.
ORP was significantly higher in EN, EN + PN40, and EN + PN50 conditions compared to CTRL before noise event onset, suggesting that the 4- to 6-minute noise-free interval was not long enough to attain sleep depth levels comparable to CTRL nights (Figure 3, F). In EN, EN + PN40, and EN + PN50 conditions ORP increased sharply after noise event onset and then gradually returned to pre-noise levels. Both EN + PN40 and EN + PN50 were associated with significantly lower ORP levels compared to EN during the first two minutes of noise event playback, but were not statistically different from EN >2 minutes after noise event onset.
While, descriptively, probabilities for wake and stage N1 as well as ORP were slightly higher, and probabilities for stage N3 and REM sleep were slightly lower for EN + EP compared to CTRL, both conditions were statistically indistinguishable from each other except for a small but significant ORP elevation in the first two minutes after noise event start.
LAS,max dose–response relationships
Prevalence of wake, stages N1 and N2, and ORP increased in a dose-dependent manner with increasing LAS,max of noise events in EN nights, while prevalence of stage N3 and REM decreased (Figure 4). The pattern was similar for EN + PN40 and EN + PN50 nights, with the exception that PN40 was able to partially mitigate the effects of EN on stage N3 reductions at 45 dB LAS,max and PN50 was able to partially mitigate the effects of EN on stage N3 reductions at 45 dB and 55 dB. Also, ORP was shifted to lower levels for EN + PN40 and even more so for EN + PN50 relative to EN.
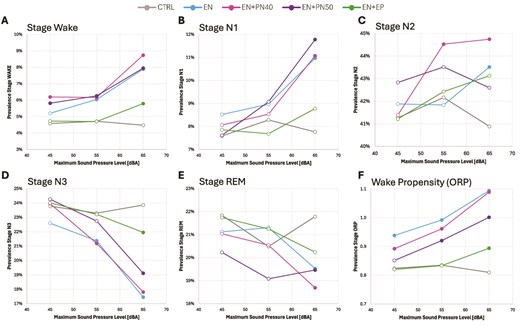
Sleep stage prevalence for a 4-minute window since noise event onset (hypnodensity; panels A-E) and ORP for a window equivalent to noise event duration (odds ratio product; panel F) depending on maximum sound pressure level LAS,max of the noise event. CTRL: Noise-free control night; EN: Environmental noise only; EN + PN40: Environmental noise plus PN at 40 dBA; EN + PN50: Environmental noise plus PN at 50 dBA; EN + EP: Environmental noise plus earplugs. Open circles reflect no statistically significant difference to CTRL (unadjusted p ≥ .05) while closed circles reflect a statistically significant difference to CTRL (unadjusted p < .05) for a given 30-second sleep epoch.

The EN + EP condition did not differ from CTRL for event levels up to 55 dB LAS,max. However, at 65 dB LAS,max, the sleep protective effect of earplugs broke down and wake probability and propensity were significantly higher while stage N3 probability was significantly lower compared to CTRL.
Physiological and cognitive measures
None of the physiological (i.e. blood pressure, heart rate variability, hearing) or cognitive (i.e. driving simulator performance, Cognition test battery performance) differed statistically significantly between study conditions (all p > .65; Table 4; additional outcomes can be found in Tables S6–S9).
Driving simulator, cognition, blood pressure, heart rate variability, and hearing test results
| CTRL | EN | EN + PN40 | EN + PN50 | PN50 | EN + EP | p | Adj. P | |
|---|---|---|---|---|---|---|---|---|
| Driving Simulator | ||||||||
| Standard Deviation Lane Position [ft] | 1.38 (1.2; 1.56) | 1.41 (1.22; 1.59) | 1.43 (1.24; 1.61) | 1.36 (1.18; 1.54) | 1.39 (1.21; 1.58) | 1.34 (1.16; 1.52) | .2193 | .6578 |
| Standard Deviation Speed [mph] | 2.51 (1.92; 3.1) | 2.69 (2.09; 3.28) | 2.84 (2.24; 3.44) | 2.88 (2.28; 3.47) | 2.74 (2.14; 3.34) | 2.46 (1.85; 3.06) | .2150 | .6578 |
| Divided Attention Mean RT [s] | 1.37 (1.28; 1.45) | 1.36 (1.27; 1.44) | 1.39 (1.3; 1.47) | 1.36 (1.28; 1.45) | 1.32 (1.24; 1.41) | 1.34 (1.26; 1.43) | .1574 | .6578 |
| Cognition | ||||||||
| Cognition Speed [z-score] | −0.09 (−0.32; 0.15) | −0.13 (−0.37; 0.1) | −0.06 (−0.29; 0.18) | −0.08 (−0.32; 0.16) | −0.14 (−0.38; 0.09) | −0.06 (−0.3; 0.18) | .5004 | .9443 |
| Cognition Accuracy [z-score] | −0.04 (−0.2; 0.13) | 0.00 (−0.16; 0.17) | 0.05 (−0.12; 0.21) | 0.04 (−0.13; 0.2) | −0.02 (−0.18; 0.15) | 0.06 (−0.12; 0.23) | .7722 | .9443 |
| Blood Pressure | ||||||||
| Systolic Blood Pressure [mmHg] | 101.0 (97.1; 104.8) | 101.5 (97.6; 105.4) | 101.8 (97.9; 105.7) | 101.8 (97.9; 105.7) | 101.2 (97.3; 105.1) | 101.0 (97.0; 104.9) | .9443 | .9443 |
| Diastolic Blood Pressure [mmHg] | 70.4 (67.6; 73.2) | 71.4 (68.5; 74.3) | 70.6 (67.8; 73.5) | 71.2 (68.3; 74.1) | 71.1 (68.2; 73.9) | 70.5 (67.6; 73.4) | .8023 | .9443 |
| Heart Rate Variability | ||||||||
| HRV Baevsky’s Stress Index [72] | 10.6 (9.5; 11.8) | 10.2 (9.0; 11.3) | 10.4 (9.3; 11.6) | 10.6 (9.5; 11.8) | 10.9 (9.8; 12.1) | 10.4 (9.2; 11.6) | .8133 | .9443 |
| HRV Mean HR [bpm] | 68.3 (64.9; 71.8) | 67.4 (64.0; 70.9) | 68.0 (64.5; 71.5) | 68.9 (65.4; 72.3) | 68.0 (64.5; 71.5) | 66.9 (63.3; 70.4) | .6330 | .9443 |
| HRV RMSSD [ms] | 39.1 (32.4; 45.7) | 40.4 (33.7; 47.1) | 39.0 (32.3; 45.7) | 38.0 (31.3; 44.7) | 37.9 (31.1; 44.6) | 39.7 (32.8; 46.5) | .8673 | .9443 |
| HRV LF-HF Ratio | 1.58 (1.03; 2.14) | 1.57 (1.01; 2.13) | 1.28 (0.7; 1.85) | 1.46 (0.89; 2.02) | 1.43 (0.86; 2.01) | 1.44 (0.86; 2.03) | .9182 | .9443 |
| Hearing Test | ||||||||
| Hearing Loss All Frequencies L/R [dB] | 4.7 (2.4; 7.1) | 5.1 (2.8; 7.5) | 4.5 (2.2; 6.9) | 4.4 (2.1; 6.8) | 4.4 (2.1; 6.8) | 4.7 (2.4; 7.1) | .1503 | .6578 |
CTRL: Noise-free control night; EN: Environmental noise only; EN + PN40: Environmental noise plus constant pink noise at 40 dBA; EN + PN50: Environmental noise plus constant pink noise at 50 dBA; PN50: Constant pink noise at 50 dBA only; EN + EP: Environmental noise plus ear plugs; cell entries reflect estimate (95% confidence interval); P: Type-III tests of fixed effects p-value; Adj. P: p-value adjusted for multiple testing according to Benjamini and Hochberg [49]; RT: Response Time; Cognition: speed and accuracy scores reflect averages across domains, higher scores reflect faster speed and higher accuracy; Hearing Test: L/R refers to values of left and right ears combined
Survey responses
Several variables reflecting self-assessment or an assessment of last night’s sleep differed significantly across study conditions (Table 5). Participants felt significantly less happy, more physically exhausted, more mentally fatigued, more tired, more tense, sleepier, scored significantly higher in terms of anger/hostility (albeit minimally), fatigue/inertia and total mood disturbance while scoring significantly lower in terms of vigor/activity on the POMS-SF in EN, EN + PN40, and EN + PN50 nights relative to CTRL (Table 6). No differences to CTRL were found for PN50 and EN + EP nights. EN + EP mitigated some of the effects of EN on tiredness, tenseness, and sleepiness. Participants also reported sleeping significantly worse than usual, sleeping shallower, waking up too often, and worse sleep quality in EN, EN + PN40, and EN + PN50 nights relative to CTRL. Difficulty falling asleep was only assessed worse than CTRL in EN + PN50 nights. Earplugs were able to mitigate these effects partially. Additional survey responses can be found in Table S10.
Morning self-assessments and assessments of last night’s sleep
| CTRL | EN | EN + PN40 | EN + PN50 | PN50 | EN + EP | p | Adj. P | |
|---|---|---|---|---|---|---|---|---|
| Morning Self-Assessment | ||||||||
| Unhappy [0-10] | 3.0 (2.2; 3.8) | 4.4 (3.5; 5.3) | 4.3 (3.4; 5.2) | 4.2 (3.3; 5.0) | 3.5 (2.7; 4.4) | 3.5 (2.6; 4.4) | .0099 | .0168 |
| Sick [0-10] | 2.0 (1.0; 2.9) | 2.5 (1.6; 3.5) | 2.5 (1.5; 3.4) | 2.5 (1.6; 3.5) | 1.9 (1.0; 2.9) | 2.0 (1.0; 2.9) | .2793 | .2857 |
| Physically Exhausted [0-10] | 3.9 (3.1; 4.8) | 5.3 (4.4; 6.1) | 5.3 (4.4; 6.1) | 5.3 (4.4; 6.1) | 4.7 (3.8; 5.6) | 4.6 (3.7; 5.5) | .0063 | .0120 |
| Mentally Fatigued [0-10] | 3.4 (2.6; 4.3) | 4.8 (3.9; 5.7) | 5.0 (4.1; 5.9) | 4.9 (4.0; 5.8) | 4.2 (3.3; 5.1) | 4.3 (3.3; 5.2) | .0066 | .0120 |
| Stressed [0-10] | 2.4 (1.4; 3.4) | 3.1 (2.0; 4.1) | 3.4 (2.4; 4.5) | 3.4 (2.3; 4.5) | 2.8 (1.7; 3.8) | 2.6 (1.5; 3.7) | .1917 | .2320 |
| Tired [1–11] | 4.1 (3.1; 5.0) | 6.8 (5.8; 7.8) | 6.8 (5.8; 7.8) | 6.5 (5.6; 7.5) | 5.3 (4.3; 6.3) | 5.0 (3.9; 6.0) | <.0001 | <.0001 |
| Tense [1–11] | 4.1 (3.3; 4.9) | 5.5 (4.7; 6.3) | 5.5 (4.7; 6.4) | 5.8 (5.0; 6.6) | 4.3 (3.4; 5.1) | 4.2 (3.3; 5.1) | .0001 | .0004 |
| Sleepy (KSS) [1–9] | 4.5 (3.9; 5.1) | 5.8 (5.2; 6.4) | 5.4 (4.8; 6.1) | 5.8 (5.1; 6.4) | 5.1 (4.4; 5.7) | 4.5 (3.8; 5.2) | <.0001 | .0001 |
| PANAS Positive Total [10–50] | 19.3 (15.7; 22.8) | 17.0 (13.4; 20.6) | 16.4 (12.8; 20.0) | 16.9 (13.3; 20.5) | 18.7 (15.1; 22.3) | 18.7 (15.0; 22.3) | .0464 | .0638 |
| PANAS Negative Total [10–50] | 10.9 (10.2; 11.6) | 11.3 (10.7; 12.0) | 11.7 (11.0; 12.4) | 11.3 (10.6; 12.0) | 11.0 (10.3; 11.7) | 10.9 (10.1; 11.6) | .2857 | .2857 |
| POMS-SF Tension-Anxiety [0-1] | 0.03 (0.00; 0.06) | 0.06 (0.03; 0.09) | 0.05 (0.02; 0.08) | 0.08 (0.04; 0.11) | 0.05 (0.02; 0.08) | 0.04 (0.01; 0.07) | .2004 | .2320 |
| POMS-SF Depression-Dejection [0-1] | 0.00 (0.00; 0.02) | 0.02 (0.00; 0.04) | 0.03 (0.01; 0.05) | 0.03 (0.01; 0.05) | 0.01 (0.00; 0.03) | 0.01 (0.00; 0.03) | .2196 | .2416 |
| POMS-SF Anger-Hostility [0-1] | 0.01 (0.00; 0.04) | 0.06 (0.04; 0.09) | 0.06 (0.03; 0.09) | 0.05 (0.03; 0.08) | 0.04 (0.02; 0.07) | 0.03 (0.00; 0.06) | .0189 | .0277 |
| POMS-SF Vigor-Activity [0-1] | 0.19 (0.12; 0.27) | 0.1 (0.03; 0.18) | 0.12 (0.04; 0.2) | 0.09 (0.02; 0.17) | 0.15 (0.07; 0.22) | 0.14 (0.06; 0.22) | .0150 | .0236 |
| POMS-SF Fatigue-Inertia [0-1] | 0.07 (0.01; 0.13) | 0.19 (0.13; 0.25) | 0.16 (0.09; 0.22) | 0.17 (0.11; 0.23) | 0.12 (0.05; 0.18) | 0.1 (0.04; 0.17) | .0006 | .0014 |
| POMS-SF Confusion-Bewilderment [0-1] | 0.03 (0.00; 0.06) | 0.06 (0.03; 0.09) | 0.05 (0.03; 0.08) | 0.05 (0.03; 0.08) | 0.04 (0.01; 0.06) | 0.03 (0.00; 0.06) | .1485 | .1921 |
| POMS-SF Total Mood Disturbance [0-1] | 0.16 (0.13; 0.19) | 0.22 (0.19; 0.24) | 0.21 (0.18; 0.23) | 0.22 (0.19; 0.24) | 0.19 (0.16; 0.22) | 0.18 (0.15; 0.21) | .0004 | .0012 |
| Assessment of Last Night’s Sleep | ||||||||
| Difficult to Fall Asleep [1–11] | 4.4 (3.3; 5.5) | 5.9 (4.8; 7.1) | 6.0 (4.8; 7.1) | 7.2 (6.1; 8.3) | 5.5 (4.3; 6.6) | 4.1 (2.9; 5.3) | .0009 | .0020 |
| Slept Worse than Usual [1–11] | 4.7 (3.7; 5.7) | 7.6 (6.6; 8.7) | 7.3 (6.2; 8.3) | 7.7 (6.7; 8.8) | 5.8 (4.7; 6.8) | 5.2 (4.1; 6.3) | <.0001 | <.0001 |
| Slept Shallow [1–11] | 4.0 (3.1; 5.0) | 7.0 (6.0; 8.0) | 6.5 (5.5; 7.6) | 7.2 (6.2; 8.3) | 4.9 (3.8; 5.9) | 5.4 (4.2; 6.5) | <.0001 | <.0001 |
| Woke Too Often [1–11] | 5.1 (4.1; 6.1) | 8.2 (7.2; 9.3) | 7.7 (6.7; 8.8) | 7.7 (6.7; 8.7) | 6.0 (5.0; 7.0) | 6.5 (5.4; 7.6) | <.0001 | <.0001 |
| Very Bad Sleep Quality [1–4] | 2.3 (1.9; 2.7) | 3.6 (3.1; 4.0) | 3.4 (3.0; 3.8) | 3.3 (2.9; 3.7) | 2.6 (2.2; 3.0) | 2.8 (2.3; 3.2) | <.0001 | <.0001 |
CTRL: Noise-free control night; EN: Environmental noise only; EN + PN40: Environmental noise plus constant pink noise at 40 dBA; EN + PN50: Environmental noise plus constant pink noise at 50 dBA; PN50: Constant pink noise at 50 dBA only; EN + EP: Environmental noise plus ear plugs; cell entries reflect estimate (95% confidence interval); range of individual scale shown in square brackets; P: Type-III tests of fixed effects p-value; Adj. P: p-value adjusted for multiple testing according to Benjamini and Hochberg [49]; KSS: Karolinska Sleepiness Scale; PANAS: Positive and Negative Affect Survey; POMS-SF: Profile of Mood States Short Form; data for additional survey responses can be found in Table S10
Post-hoc tests for the effects of environmental noise, pink noise, earplugs and their combination on self-assessments and assessments of last night’s sleep
| EN - CTRL | PN50 - CTRL | EN + PN40 - CTRL | EN + PN50 - CTRL | EN + EP - CTRL | EN + PN40 - EN | EN + PN50 - EN | EN + EP - EN | EN + PN50 - EN + PN40 | |
|---|---|---|---|---|---|---|---|---|---|
| Morning Self-Assessment | |||||||||
| Unhappy [0-10] | 1.4 (0.4)* | 0.5 (0.4) | 1.3 (0.4)* | 1.2 (0.4)* | 0.5 (0.5) | −0.1 (0.5) | −0.2 (0.4) | −0.9 (0.5) | −0.2 (0.5) |
| Physically Exhausted [0-10] | 1.3 (0.4)** | 0.8 (0.4) | 1.3 (0.4)** | 1.3 (0.4)** | 0.6 (0.4) | 0.0 (0.4) | 0.0 (0.4) | −0.7 (0.5) | 0.0 (0.4) |
| Mentally Fatigued [0-10] | 1.4 (0.5)** | 0.8 (0.5) | 1.6 (0.5)** | 1.5 (0.5)** | 0.9 (0.5) | 0.2 (0.5) | 0.1 (0.5) | −0.6 (0.5) | −0.1 (0.5) |
| Tired [1–11] | 2.8 (0.6)**** | 1.2 (0.6) | 2.8 (0.6)**** | 2.5 (0.6)*** | 0.9 (0.6) | 0.0 (0.6) | −0.3 (0.6) | −1.8 (0.6)** | −0.3 (0.6) |
| Tense [1–11] | 1.4 (0.5)** | 0.2 (0.5) | 1.4 (0.5)** | 1.7 (0.5)** | 0.1 (0.5) | 0.0 (0.5) | 0.2 (0.5) | −1.3 (0.5)* | 0.2 (0.5) |
| Sleepy (KSS) [1–9] | 1.3 (0.3)*** | 0.6 (0.3) | 0.9 (0.3)* | 1.3 (0.3)*** | 0.0 (0.3) | −0.4 (0.3) | 0.0 (0.3) | −1.3 (0.3)*** | 0.3 (0.3) |
| POMS-SF Anger-Hostility [0-1] | 0.05 (0.02)* | 0.03 (0.02) | 0.05 (0.02)* | 0.04 (0.02)* | 0.02 (0.02) | 0.00 (0.02) | −0.01 (0.02) | −0.03 (0.02) | −0.01 (0.02) |
| POMS-SF Vigor-Activity [0-1] | −0.09 (0.03)* | −0.05 (0.03) | −0.08 (0.03)* | −0.1 (0.03)* | −0.05 (0.03) | 0.01 (0.03) | −0.01 (0.03) | 0.04 (0.03) | −0.02 (0.03) |
| POMS-SF Fatigue-Inertia [0-1] | 0.12 (0.03)*** | 0.05 (0.03) | 0.09 (0.03)* | 0.1 (0.03)** | 0.03 (0.03) | −0.03 (0.03) | −0.02 (0.03) | −0.09 (0.03)* | 0.01 (0.03) |
| POMS-SF Total Mood Dist. [0-1] | 0.06 (0.01)*** | 0.03 (0.01) | 0.05 (0.01)** | 0.06 (0.01)*** | 0.02 (0.02) | −0.01 (0.02) | 0.00 (0.01) | −0.04 (0.02)* | 0.01 (0.02) |
| Assessment of Last Night’s Sleep | |||||||||
| Difficult to Fall Asleep [1–11] | 1.5 (0.7) | 1.1 (0.7) | 1.6 (0.7) | 2.8 (0.7)** | −0.3 (0.8) | 0.0 (0.8) | 1.3 (0.7) | −1.8 (0.8) | 1.2 (0.8) |
| Slept Worse than Usual [1–11] | 3.0 (0.6)**** | 1.1 (0.6) | 2.6 (0.6)*** | 3.1 (0.6)**** | 0.5 (0.7) | −0.4 (0.7) | 0.1 (0.7) | −2.4 (0.7)** | 0.5 (0.7) |
| Slept Shallow [1–11] | 3.0 (0.6)**** | 0.8 (0.6) | 2.5 (0.6)*** | 3.2 (0.6)**** | 1.3 (0.7) | −0.5 (0.7) | 0.2 (0.7) | −1.6 (0.7)* | 0.7 (0.7) |
| Woke Too Often [1–11] | 3.1 (0.6)**** | 0.9 (0.6) | 2.6 (0.6)**** | 2.6 (0.6)**** | 1.4 (0.6) | −0.5 (0.6) | −0.6 (0.6) | −1.8 (0.6)* | −0.1 (0.6) |
| Very Bad Sleep Quality [1–5] | 1.2 (0.3)**** | 0.3 (0.3) | 1.1 (0.3)*** | 1.0 (0.3)*** | 0.5 (0.3) | −0.2 (0.3) | −0.3 (0.3) | −0.8 (0.3)* | −0.1 (0.3) |
CTRL: Noise-free control night; EN: Environmental noise only; EN + PN40: Environmental noise plus constant pink noise at 40 dBA; EN + PN50: Environmental noise plus constant pink noise at 50 dBA; PN50: Constant pink noise at 50 dBA only; EN + EP: Environmental noise plus ear plugs; cell entries reflect estimate (standard error); range of individual scale shown in square brackets; p-values were adjusted for multiple testing (n = 9) according to Benjamini and Hochberg [49] and are coded as:
*adj. p < .05.
**adj. p < .01.
***adj. p < .001.
****adj. p < .0001.
Numerical unadjusted and adjusted p-values can be found in Supplementary Tables S17 and S18.
When asked how much the constant background noise bothered or disturbed participants, the majority chose not at all (29.5%) or slightly (37.2%, Table S11). When asked what effect the constant background noise had on the quality of participants’ sleep, the majority said they slept a little worse (38.5%, average rating of 3.18 on a 1-5 scale, Table S12).
Participants were also asked about wear-comfort after nights during which they wore earplugs. Most participants rated the earplugs as very comfortable (33.3%), somewhat comfortable (28.6%), or neither comfortable nor uncomfortable (28.6%). Only two participants (9.5%) rated them as somewhat uncomfortable, and nobody rated them as very uncomfortable (Table S13). When asked what effects earplugs had on the quality of their sleep compared to sleeping without them, 42.9% of participants said they slept much better and another 42.9% said they slept a little better (Table S14).
Discussion
This randomized, controlled, cross-over, polysomnographic sleep laboratory study investigated the effects of EN and PN on sleep, next day performance and subjective assessments, and how well earplugs and PN at two different levels were able to mitigate the effects of EN on sleep.
Environmental noise effects on sleep
The defining effect of EN on sleep structure was a reduction in SWS and sleep depth assessed via ORP, largely in exchange for more stage N2 sleep and to a lesser degree stage N1 sleep and wake. While time spent in REM sleep was also reduced to a lesser extent, it did not differ significantly from CTRL nights. EEG arousal frequency as a measure of sleep fragmentation was also significantly higher in EN relative to CTRL nights. These findings are largely consistent with a previous large laboratory study on the effects of traffic noise on sleep [36]. Event-related analyses demonstrated a steep decline of stage N3 hypnodensity during noise event playback with a slow recovery after playback ended that was not complete at the end of the 4-minute observation window. This suggests that intermittent noise disrupts SWS, and that it takes time for the brain to re-enter deep sleep after the noise event ends. Thus, both the noise level and timing of noise events are critical for the degree of N3 reduction specifically and sleep disturbance more general [50]. Any successful mitigation measure would therefore either need to prevent the disruption of N3 sleep, accelerate re-entering N3 sleep, or both. In addition to objectively measured sleep structure, subjective morning assessments of psychological health and mood and previous night’s sleep were significantly worse after EN nights compared to CTRL nights for a range of response domains.
PN effects on sleep
The defining effect of PN at a level of 50 dB (without EN) on sleep was a significant reduction in REM sleep duration, largely in exchange for more light sleep N2. Sleep macrostructure was otherwise unaffected. Likewise, neither sleep fragmentation nor sleep depth seemed to be affected by PN. Finally, subjective assessments of sleep, alertness, and mood did not differ between CTRL and PN nights. These findings largely confirm findings of previous, often smaller PSG studies on the effects of BN [51–54] or continuous traffic [55, 56] or wind turbine noise [57] (which can be broadband in nature) on predominantly REM sleep, sometimes in a dose-dependent fashion.
Neurons in the midbrain and hypothalamus seem to be critical for the initiation and maintenance of REM sleep [58]. A possible explanation for increased REM latency and the reduction of time spent in REM sleep is that central nervous system projections originating from cochlear neurons can inhibit midbrain and hypothalamus neuronal populations during constant playback of PN. Indeed, time course analyses performed in this study confirm that PN both increases the fragility of REM sleep in the presence of intermittent noise and prevents the re-initiation of REM sleep after EN playback ends (see Figure 3, E). However, additional mechanistic studies are clearly warranted to elucidate how PN interferes with REM sleep.
While many functions of REM sleep are still unknown, it has been implicated in memory formation [59], brain plasticity [60], and emotion regulation with links between REM sleep abnormalities and psychiatric disorders including depression, post-traumatic stress disorder (PTSD), and anxiety [61]. Also, REM sleep behavior disorder serves as a prodromal biomarker for neurodegenerative disorders including Parkinson’s Disease and dementia with Lewy bodies [62, 63], possibly mediated through glymphatic system dysfunction [64]. This suggests that long-term exposure to PN during sleep, should there be no habituation to its effects on REM sleep, could be detrimental to memory, brain plasticity, emotional processing, and potentially increase the risk for neurodegenerative disease, which is concerning given the high prevalence of BN use during sleep. Long-term exposure studies, as well as observational studies, are needed to confirm this link.
Furthermore, REM sleep is crucial for neurodevelopment and cortical maturation especially during the early stages of development [65]. REM sleep accounts for ~50% of sleep in full-term newborns and decreases continuously until it stabilizes at ~20% around age 3 [66]. Thus, the common practice of parents to use BN in the bedroom of their newborns and toddlers may be detrimental for neurodevelopment given the importance of REM sleep during the early stages of life. It could be that BN consolidates the otherwise highly fragmented sleep of newborns (see below), and that this is misinterpreted as a sleep improvement by parents, when in fact critical neurodevelopmental mechanisms may be impaired through REM sleep deprivation.
To our knowledge, the direct evidence for BN effects on neurodevelopment in infants is limited [22]. More experimental and observational research is needed in chronic exposure situations and in the home setting. While it is not clear how the findings of this study generalize to younger populations and chronic exposure scenarios, they caution against the use of BN in newborns and toddlers until confirmatory studies are completed.
The fact that EN primarily reduced SWS while PN primarily reduced REM sleep suggests that the mechanisms by which intermittent and continuous noise interfere with sleep are fundamentally different. While intermittent noise primarily causes autonomic and cortical arousals mediated through the Ascending Reticular Activating System (ARAS) and the thalamus that ultimately reduce the time spent in N3 sleep [5], continuous noise seems to primarily inhibit neuronal populations in the midbrain and hypothalamus that are crucial for REM sleep initiation and maintenance. As average sound levels are agnostic to the degree of intermittency in the original sound signal, it will be important to characterize the intermittent character of the soundscape in observational studies on the effects of traffic noise on sleep [67].
PN for the mitigation of EN effects on sleep
Based on the distinct differences in the effects of EN (fragmentation and SWS reduction) and PN (REM sleep reduction) on sleep discussed above, using PN to mitigate the negative effects of EN on sleep seems counterintuitive. Indeed, not only was the time spent in N3 and in REM sleep significantly reduced in nights with both EN and PN compared to CTRL, TST and sleep efficiency were also significantly reduced while time spent awake significantly increased. The latter was seen neither in EN or PN50 nights, suggesting this is a unique effect of combining intermittent noise with continuous BN. Thus, adding PN to EN clearly worsened sleep architecture instead of improving it. While subjective assessments of sleep, alertness, and mood were significantly worse after EN + PN40 and EN + PN50 nights relative to CTRL, there were no differences relative to EN nights.
There were some positive effects of PN, though. PN exposure during periods with EN playback was associated with a dose-dependent reduction in awakening frequency, EEG arousal frequency, and ORP. This is in line with a study by Stanchina et al. who found that an increase in arousal frequency induced by simulated ICU noise could be mitigated by WN [68]. Event-related analyses suggest masking may play a critical role for this sleep protective effect. EN + PN50 was associated with lower ORP at all EN levels compared to EN nights, including LAS,max 65 dB, while ORP was practically identical to EN in EN + PN40 nights at LAS,max 65 dB (Figure 4, F). Also, WASO and awakening duration were significantly increased in EN + PN40 nights compared to control, but not in EN + PN50 nights. However, our study also suggests that sleep fragmentation during noise-free intervals was slightly higher in EN + PN40 and EN + PN50 compared to EN nights, diminishing some of the positive PN effects when viewed across the whole night (Figure 2).
Notably, there were some benefits of PN for protecting N3 sleep, especially at 50 dB. While not statistically significant, participants spent 7.7 minutes (EN + PN50) and 2.2 minutes (EN + PN40) more in N3 compared to EN nights. A dose–response effect again suggests that masking may play a prominent role in this EN mitigating effect (Figure 3, D). At the same time, participants spent 7.6 minutes less in REM sleep in EN + PN50 nights compared to EN + PN40 nights. This hints at a sound level-dependent delicate balance between REM fragmenting and N3 consolidating effects of PN. However, sleep structure differences between EN + PN50 and EN + PN40 were small (mean |z| = 0.19) and statistically non-significant, so they need to be interpreted with caution.
Earplug efficacy
As mentioned in the introduction, the evidence for the efficacy of earplugs in promoting sleep in noisy environments is mixed. In this study, earplugs emerged as clearly superior in their efficacy to mitigate negative effects of intermittent EN on sleep in comparison with constant PN exposure. Wearing earplugs recovered 16.9 minutes of the 23.4 minutes (or 72%) of the EN-induced reduction in N3 sleep. Also, none of the measured sleep structure variables or subjectively assessed sleep, mood, and alertness differed statistically significantly in EN + EP compared to CTRL nights. Event-related analyses showed near full mitigation of EN effects up to 55 dB LAS,max (Figure 4). Only at the highest LAS,max of 65 dB did effects of EN become visible in EN + EP nights. In a recent field study on the effects of ENEs on sleep [37], only 6.7% of more than 38 000 recorded ENEs exceeded LAS,max 55 dB, i.e. even if earplugs stopped working at LAS,max 55 dB, and not somewhere between 55 and 65 dB, the effects of the vast majority of ENEs would be fully mitigated. The standard earplugs used in this study provided an average attenuation of 25.5 dB. An LAS,max of 65 dB would thus be perceived at around 40 dB, which seemed to be just enough relative to the laboratory background noise level of 23.7 dB to elicit responses and is in line with the current noise-effects literature [38].
The findings of studies investigating earplug wear comfort and adherence of wearing earplugs in clinical trials is mixed [31–33]. This study suggests that participants overwhelmingly found earplugs comfortable to wear, and the majority of subjects thought they slept better wearing earplugs. This study used affordable foam earplugs to increase generalizability of findings. It is likely that both comfort and sound attenuation could be further improved by using high-fidelity or even custom-fit earplugs instead, although this would have to be shown.
Effects on physiological measures and cognitive performance
The results did not indicate differences between study conditions relative to morning cardiovascular measurements (blood pressure, heart rate and heart rate variability) and cognitive performance (Cognition test battery and driving simulator). While the study was not powered for these outcomes, differences between conditions were so small that very large sample sizes would have been required to find them statistically significant. For example, estimates for morning systolic blood pressure and heart rate varied between 101.0 mmHg and 101.8 mmHg and between 66.9 bpm and 68.9 bpm, respectively. Noise exposure scenarios were chosen to induce a significant degree of sleep disturbance while not exposing participants to a degree that would result in study discontinuation. While sleep structure was clearly affected by the noise scenarios, TST still averaged 7.1 hours even in the worst case, which is above the daily seven hours of sleep typically recommended for adults [69, 70]. This suggests that more or louder events, shorter sleep opportunity (i.e. TIB), prolonged exposure (in terms of days exposed), or a combination of the above is needed to induce physiological or cognitive next day consequences.
Hearing thresholds
This study found no impact of PN playback on next morning hearing thresholds. A previous small study exposed eight male college students to white noise at 92 dBA during several 8-hour sleep periods [51]. Morning hearing tests showed “small temporary threshold shifts” that were not further described. They were no longer detectable on hearing tests administered on the subsequent evening. Compared to the maximal PN exposure of 50 dB that was used in this study, 92 dB represent a more than 10 000-fold increase in sound energy and would only be allowed for short time periods in occupational settings. While we did not find threshold shifts with pure tone audiometry up to 16 kHz in this study, this does not mean that these levels are safe for chronic exposure. Constant PN exposure may have more subtle yet still important consequences for hearing and auditory processing that were not addressed in this study. For example, a clinical review by Attarha et al. on white noise therapy in tinnitus patients concluded that “white noise exposure […] engages […] plastic processes in a way that induces maladaptive changes in the brain that degrade neurological health and compromise cognition” [71]. These authors advised against the use of unstructured, random (“white”) noise for the therapy of tinnitus.
Survey responses
Nights with EN exposure were assessed significantly worse on a range of survey domains. Wearing earplugs mitigated some of these effects. In contrast, there were no significant differences in survey responses between PN50 and CTRL nights, suggesting that intermittent NEs were driving the negative survey responses. Intermittent NEs can not only cause awakenings but also interfere with the process of falling back to sleep, when they may be consciously perceived and contribute to negative survey responses. Adding PN to EN neither improved nor worsened survey responses statistically significantly. Thus, the small benefits of PN in reducing sleep fragmentation and increasing N3 sleep did not translate to improved survey responses, which were likely still driven by audible EN events.
Limitations
The study has several limitations that need to be considered when interpreting its results. This was a short-term exposure study in a relatively small sample of participants naïve to broadband sounds during sleep. The findings may thus not generalize to longer exposure periods. We investigated a young and healthy population and thus findings may not generalize to younger, older, or non-healthy populations. Also, while bedrooms were acoustically calibrated, loudspeakers did not reproduce the recorded noise events perfectly, especially in the very low frequency range. This limits generalizability to real-world settings.
REM sleep duration increased across study nights. As three out of six study conditions included PN playback, and as a REM sleep reduction was the most prominent effect of PN, this could be a sign of increasing REM sleep pressure due to selective REM sleep deprivation. It could also be a sign of habituation to PN. In a study on the effects of white noise on sleep of eight male college students, Scott found a rebound of REM sleep after three 8-hour nights of WN exposure to 92 dBA, suggesting REM sleep deprivation during exposure nights [51]. Unfortunately, the current study design does not allow us to disentangle REM sleep deprivation versus PN habituation effects. Additional long-term exposure studies are needed.
A general problem of this type of study is the large variety in sound exposure, i.e. type and sound pressure level of EN events and type and sound pressure level of broadband sound. In addition to one alarm sound and one baby crying sound, we chose common and newly emerging sources of transportation noise for playback. Therefore, results may not transfer to other noise sources and events. We played EN back at LAS,max levels of 45, 55, and 65 dB, which reflect the 62nd, 93rd, and 99th percentile of LAS,max levels measured in a recent field study on the effects of aircraft noise on sleep [37]. It is thus not clear how findings translate to noise events with especially lower noise levels. We chose PN for this study, but there are several other broadband sounds (e.g. white, brown, blue) that differ in their sound energy across the audible spectrum, as well as a large number of nature sounds that are broadband in nature. While it is infeasible to investigate all possible combinations, a crucial next step before any long-term exposure field studies will be to identify the optimal noise color and noise level for mitigating the effects of EN on sleep, with the goal to gain the largest possible sleep protection effect at the lowest possible noise level.
Conclusions
This study investigated the mitigating effects of PN and earplugs on intermittent EN-induced sleep disturbance. The distinct signature of EN exposure was a reduction of deep N3 sleep, while PN reduced REM sleep initiation and maintenance. Aside from reducing EN-induced sleep fragmentation and deep sleep reduction to some degree, adding PN to intermittent EN was a largely unsuccessful mitigation strategy and worsened sleep structure. Given the widespread use of broadband sounds in the population, and that appliances like air conditioning units and fans also produce broadband sounds, the observed reduction in REM sleep is concerning considering the important contributions of REM sleep for memory formation, brain plasticity, and emotion regulation. Based on these findings, it is likely warranted to discourage the popular use of broadband sounds in newborns and toddlers, as REM sleep plays a critical role for neurodevelopment in these age groups, although further confirmatory studies are needed. Earplugs compared favorably against PN, as they were able to mitigate most of the negative effects of intermittent EN on sleep for all EN levels but the highest one. Future studies are needed to identify optimal noise color and level of broadband sounds before investigating effects of long-term exposure in the field.
Acknowledgments
The authors would like to thank study participants; Christopher Hobbs for providing and modifying sound files; Vic Sparrow, Andrew Barnard and Michelle Vigeant-Haas for assisting in the acoustical setup of the laboratory; Manfred Liepert of Möhler + Partner Ingenieure AG for providing the outdoor-to-indoor transfer function; Uwe Müller for acoustical support.
Author contributions
MB, MGS, MC, HS, QC, CWJ conceived and designed the study. MB, MSK, MC, AJE, SPC, YG, KR, VS, SW, CWJ were involved in data acquisition and data quality control assessment. MB performed statistical analysis. MB drafted the manuscript. All authors revised and approved the manuscript.
Funding/Support
This research was funded by the U.S. Federal Aviation Administration Office of Environment and Energy through ASCENT, the FAA Center of Excellence for Alternative Jet Fuels and the Environment, project 86 through FAA Award Number 13-C-AJFE-UPENN under the supervision of Susumu Shirayama. Any opinions, findings, conclusions or recommendations expressed in this material are those of the authors and do not necessarily reflect the views of the FAA.
Disclosure statement
Financial disclosure: None.
Non-financial disclosure: MY developed, and has a patent on, the ORP Technology. ORP analysis is provided free of charge for academic research.
Data availability
Public project data files are available via the National Transportation Library (NTL).