Abstract
The SARS-CoV-2 Omicron subvariant BA.3.2 descends from BA.3. It emerged two years after BA.3 ceased to circulate and differs by 39 spike mutations from BA.3. Similar to BA.2.86, which circulated at low levels before giving rise to JN.1, BA.3.2 shows a low but persistent circulation globally. Here, we characterize the phylogenetic origin, infection in cell culture, and neutralization of BA.3.2 using live virus and blood plasma samples collected in South Africa at different stages of the Covid-19 pandemic. Like the Omicron BA.2.86 subvariant, we find that BA.3.2 likely emerged in Southern Africa. We also find that an 871 bp deletion removed ORF7 and ORF8. In H1299-ACE2 cells, BA.3.2 has lower cytotoxicity measured as plaque area compared to ancestral SARS-CoV-2 but similar to the co-circulating LP.8.1 Omicron subvariant with which it also shares similar replication and infection focus size. BA.3.2 and LP.8.1 exhibit complete escape from neutralization from pre-Omicron collected plasma samples, have low levels of neutralization by plasma collected in 2024, and higher neutralization by plasma collected in 2025, with BA.3.2 showing moderately lower neutralization than LP.8.1. The emergence of long branch subvariants like BA.3.2 without intermediates likely indicates that unmonitored persistent infections continue to drive large evolutionary shifts in this virus.
Introduction
The ongoing diversification of the SARS-CoV-2 Omicron lineage has produced multiple sub-lineages with distinct biological and immunological features and this process seems to continue in the face of rising levels of immunity to SARS-CoV-2 (Sigal et al. 2024). BA.3.2 is a recently emerged Omicron subvariant first detected in South Africa (Zhang et al. 2025). BA.3.2 is a descendant of BA.3, an Omicron subvariant with limited circulation which first emerged in Southern Africa in late 2021, concurrently with BA.1 and BA.2 (Dor et al. 2025b). BA.3 last circulated in 2022 (Chatterjee et al. 2023) and showed relatively limited spread, mostly in the South African region (Desingu et al. 2022). BA.3.2 contains 51 overall and 39 spike mutations relative to the BA.3 subvariant. So far, it caused relatively few confirmed infections from November 2024 when it was first detected, but these are widely distributed, including in South Africa, Australia, the Netherlands, and the USA (covSPECTRUM 2025). Recent wastewater surveillance in Australia shows it is still present (Health WADo 2025).
While their origin cannot be conclusively proven, saltations such as BA.2.86 and BA.3.2, which have large numbers of mutations and no known circulating intermediates, are thought to evolve in persistent infections in immunocompromised people (Sigal et al. 2024). Given that SARS-CoV-2 and other coronaviruses have proofreading activity, the frequency of mutations is low relative to other RNA viruses (Amicone et al. 2022). Persistent infections are a mechanism to accumulate mutations that are otherwise lost at the transmission bottleneck in infections with a short duration (Sigal et al. 2024). The evolutionary dynamics of BA.3.2 are similar to BA.2.86, which emerged in 2024 (Khan et al. 2023). The number of mutations is roughly comparable. Similar to BA.3.2, BA.2.86 did not initially lead to many infections. However, evolution of the L455S substitution in spike led to the JN.1 subvariant, which subsequently dominated SARS-CoV-2 infections globally (Yang et al. 2024).
Examining the origin of BA.2.86, we found that the closest ancestor was BA.2 circulating in Southern Africa in 2021–22 and the closest BA.2.86 to the root of the BA.2.86 branch was also found in Southern Africa (Khan et al. 2023). This makes it likely that BA.2.86 evolved in the Southern African region. Other variants and subvariants thought to evolve in Southern Africa are Beta, BA.1, BA.2, and BA.3, making the region a hotspot for long-branch variants (Sigal et al. 2024). This concentration may be explained by the locally high prevalence of immunocompromise because of advanced Human Immunodeficiency Virus (HIV) disease (Sigal et al. 2024).
There have been two previous studies that used the spike protein from BA.3.2 in a pseudotyped virus system to examine BA.3.2 cell entry and escape from neutralizing antibodies (Guo et al. 2025, Zhang et al. 2025). The results showed that the BA.3.2 spike had higher escape from neutralizing antibodies in sera from participants with various histories of SARS-CoV-2 vaccination compared with the co-circulating LP.8.1 (Guo et al. 2025, Zhang et al. 2025). However, the pseudotyped virus with the BA.3.2 spike showed reduced entry into human Calu-3 lung cells (Zhang et al. 2025) and low infectivity of Vero cells relative to LP.8.1 (Guo et al. 2025).
The viral cytopathic effect, replication, and cell-to-cell spread or fusion are often used to compare variants in vitro to give an indication of their properties (Matsuyama et al. 2020, Mlcochova et al. 2021, Kimura et al. 2022, Meng et al. 2022, Saito et al. 2022, Suzuki et al. 2022, Tamura et al. 2023). Cell-to-cell spread of SARS-CoV-2 can be quantified by a focus-forming assay where infection is restricted to infecting only nearby cells using a carboxymethylcellulose overlay (Meng et al. 2022). Omicron subvariants tend to infect through the cathepsin-dependent endocytic pathway and show relatively poor TMPRSS2-dependent plasma membrane infection (Buchrieser et al. 2020, Hörnich et al. 2021, Zeng et al. 2022) and cell-to-cell spread, while pre-Omicron strains show a preference for TMPRSS2-dependent cell entry and induce higher cell-to-cell spread (Meng et al. 2022, Suzuki et al. 2022). Cell fusion was measured for BA.3.2 spike and found to be similar to LP.8.1.1 (Zhang et al. 2025). Since the live BA.3.2 virus was not tested, the cytopathic effect (CPE) and replication were not measured.
In this work, we characterized the live BA.3.2 virus that we isolated from a swab from the national South African sentinel surveillance programme. We used the live virus to test for escape from neutralization by blood plasma collected in South Africa at different timepoints during the pandemic. We found that this isolate had complete deletions of ORF7 and ORF8. This deletion seems to occur in almost all BA.3.2 sequences to date. Phylogenetic analysis revealed a likely Southern African origin for BA.3.2. By the measures of CPE, replication, and cell-to-cell spread, BA.3.2 was found to be very similar to LP.8.1. When the 2025 collected sera were tested in their ability to neutralize BA.3.2 and LP.8.1, BA.3.2 had moderately higher escape from antibody neutralization. This data shows that, despite the lower infectivity of BA.3.2 spike reported in pseudovirus assays, BA.3.2 shows similar cell culture infection properties to LP.8.1 while maintaining a neutralization escape advantage. It may therefore have the potential to acquire further mutations that may give it a fitness advantage to spread further.
Materials and methods
Informed consent and ethical statement
All blood samples used for neutralization studies, as well as nasopharyngeal swabs for isolation of the ancestral/D614G and Delta virus were collected from adults (>18 years old) enrolled at King Edward VIII, Inkosi Albert Luthuli Central, or Clairwood hospitals; the Kwadabeka Community Health Centre; or the University of KwaZulu-Natal Medical School Campus, all in Durban, South Africa. Written informed consent was obtained. This study was approved by the Biomedical Research Ethics Committee at the University of KwaZulu-Natal (reference BREC/00001275/2020). The Omicron BA.1, JN.1, LP8.1, and BA.3.2 viruses were isolated from residual swabs used for diagnostic testing, as approved by the Witwatersrand Human Research Ethics Committee (reference M210752).
Data and reagent availability statement
Viral isolates are available upon reasonable request to the authors. Sequences of isolated SARS-CoV-2 used in this study have been deposited in Global Initiative on Sharing All Influenza Data (GISAID) with accession numbers as follows: D614G (EPI_ISL_602626.1), Delta (EPI_ISL_3118687), BA.1 (EPI_ISL_7886688), JN.1 (EPI_ISL_20134377), LP.8.1 (EPI_ISL_20134454), and BA.3.2 (EPI_ISL_19885628). All data produced in the present study are available upon reasonable request to the authors.
Clinical laboratory testing
HIV viral load quantification was performed at an accredited diagnostic laboratory (Molecular Diagnostic Services, Durban, South Africa). The CD4 count was performed by an accredited diagnostic laboratory (Ampath, Durban, South Africa).
Whole-genome sequencing
Sequencing was performed on an Illumina MiSeq or NextSeq 550 instrument or, alternatively, the Oxford Nanopore instrument. For Illumina sequencing, total nucleic acid was extracted on an automated Chemagic 360 instrument, using the CMG-1033-S kit (Perkin Elmer, Hamburg, Germany). Libraries for whole genome sequencing were prepared using the Illumina COVIDseq Assay as per the manufacturer’s instructions. For the Illumina COVIDseq assay, amplicons were tagmented, followed by indexing using the Illumina Unique Dual (UD) Indexes. Sequencing libraries were pooled and normalized to 4 nM. An 8 pM sample library was spiked with 1% PhiX (PhiX Control v3 adaptor-ligated library used as a control). Libraries were sequenced using a 500-cycle v2 MiSeq Reagent Kit on the Illumina MiSeq instrument (Illumina Inc, USA). On the Illumina NextSeq 550 instrument, sequencing was performed using the Illumina COVIDSeq protocol (Illumina Inc., USA). First-strand synthesis was done using random reverse-transcriptase and hexamer primers. The SARS-CoV-2 genome was amplified using the Artic V5.4.2 NCOV-2019 Panel, Pool 1 and 2. The pooled PCR-amplified products were processed for tagmentation and adapter ligation done with Illumina UD indexes. Further enrichment and cleanup were performed as per manufacturer’s instructions (Illumina Inc, USA). Pooled samples were quantified using Qubit 4.0 fluorometer (ThermoFisher Scientific, Oregon, USA) using the Qubit dsDNA High Sensitivity assay according to the manufacturer’s instructions. The fragment sizes were analysed using TapeStation 4 200 (Agilent Technologies, Santa Clara, CA). Pooled libraries were normalized to 4 nM concentration, and 25 μl of each normalized pool containing unique index adapter sets were combined in a new tube. The final library pool was normalized to 0.65 pM and spiked with 10% PhiX. Libraries were loaded onto a 300-cycle P1 NextSeq reagent kit (Illumina Inc, USA) and run on the Illumina NextSeq 1000/2000 instrument (Illumina, San Diego, CA, USA). For Illumina assembly, GATK HaploTypeCaller --min-pruning 0 argument was added to increase mutation calling sensitivity near sequencing gaps. For Oxford Nanopore sequencing, the Midnight Primer kit (Oxford Nanopore Technologies, UK) was used as described by Freed et al. (2020) (Freed et al. 2020). RNA extraction was done using the QIAamp Viral RNA Mini kit as per the manufacturer’s instructions (Qiagen, Germany). Complimentary DNA (cDNA) synthesis was performed on the extracted RNA using LunaScript RT mastermix (New England Biolabs, USA), followed by gene-specific multiplex PCR using the Midnight Primer pools, which produce 1200 bp amplicons that overlap to cover the 30-kb SARS-CoV-2 genome. Amplicons from each pool were pooled and used neat for barcoding with the Oxford Nanopore Rapid Barcoding kit (Oxford Nanopore Technologies, UK) as per the manufacturer’s protocol. Barcoded samples were pooled and bead-purified. After the bead clean-up, the library was loaded on a prepared R10.4.1 flow-cell. A MinION sequencing run was initiated using MinKNOW software with the base-call setting switched off. We assembled paired-end and nanopore.fastq reads using Genome Detective 2.21.3 (https://www.genomedetective.com), which was updated for the accurate assembly and variant calling of tiled primer amplicon Oxford Nanopore reads, and the Coronavirus Typing Tool. Additionally, the ARTIC SARS-CoV-2 pipeline (wf-artic) from EPI2ME Labs was executed using the Nextflow workflow framework. The reference genome used throughout the assembly process was NC_045512.2 (numbering equivalent to MN908947.3). To determine clade assignment, mutation changes, and quality scores, consensus FASTA files were entered into Nextclade (https://clades.nextstrain.org/). Mutations were then visualized in Microsoft Excel relative to the infecting variant.
Phylogenetic analysis
Phylogenetic analysis is based on EPI_SET_251022ev. We assembled a set of 727 BA.3 (Nextstrain clade 21 M) sequences collected between November 2021 and June 2022 from data deposited on GISAID (Shu and McCauley 2017). BA.3.2 sequences were downloaded on 15 October 2025 directly from GISAID. We excluded sequences flagged as poor quality by Nextclade (Aksamentov et al. 2021). Sequences were pairwise-aligned against Wuhan-Hu-1 using Nextclade. A tree was built using IQ-tree 2 (Minh et al. 2020) and postprocessed using a custom script to correct for incomplete merging of branches in large polytomies. A time tree was inferred by TreeTime (Sagulenko et al. 2018) using a clock rate of 0.0005 per site and year (Neher 2022). The rate of the long branch between BA.3 and BA.3.2 was set to be two times the rate of the rest of the tree, in line with previous observation that evolution is two-fold accelerated along many long branches leading to distinct clades. This acceleration is consistent with the strong enrichment of amino acid substitutions in the spike protein along the long branch leading to BA.3.2, suggesting that evolution along this branch is dominated by adaptive changes. The full workflow to reproduce the analysis is available at https://www.github.com/neherlab/BA_3_2. The repository contains a specific list of sites (config/mask.tsv) that are masked in individual sequences due to suspicion of being artefactual reversions.
Cells
The VeroE6 cells expressing TMPRSS2 and ACE2 (VeroE6-TMPRSS2), originally BEI Resources, NR-54970, were used for virus expansion and all live virus assays excluding replication and plaque assay. The Vero-TMPRSS2 cell line was propagated in growth medium consisting of Dulbecco’s Modified Eagle Medium (DMEM, Gibco 41 965-039) with 10% fetal bovine serum (Hyclone, SV30160.03) containing 10 mM of hydroxyethylpiperazine ethanesulfonic acid (HEPES, Lonza, 17-737E), 1 mM sodium pyruvate (Gibco, 11 360-039), 2 mM L-glutamine (Lonza BE17-605E), and 0.1 mM nonessential amino acids (Lonza 13-114E). The H1299-E3 (H1299-ACE2, clone E3) cell line used in the plaque and replication assays was derived from H1299 (CRL-5803) and propagated in growth medium consisting of complete Roswell Park Memorial Institute (RPMI, Gibco, 21 875-034) 1640 with 10% fetal bovine serum containing 10 mM of HEPES, 1 mM sodium pyruvate, 2 mM L-glutamine and 0.1 mM nonessential amino acids.
Virus expansion
All work with live virus was performed in Biosafety Level 3 containment using protocols for SARS-CoV-2 approved by the Africa Health Research Institute Biosafety Committee. VeroE6-TMPRSS2 cells were seeded at 4.5 × 10⁵ cells in a 6-well plate and incubated for 18–20 h pre-infection. After one Dulbecco’s phosphate-buffered saline wash, the sub-confluent cell monolayer was inoculated with 500 μl of universal transport medium that contained the swab, diluted 1:2 with growth medium filtered through a 0.45 μm filter. Cells were incubated for 2 h at 37°C, 5% CO2. Wells were then filled with 3 ml complete growth medium. After 3 days of infection [completion of passage 1 (P1)], supernatant was collected; cells were trypsinized, centrifuged at 300 × g for 3 min, and resuspended in 3 ml growth medium. All infected cells and supernatant were added for cell-to-cell infection to VeroE6-TMPRSS2 cells, with medium removed, that had been seeded at 1.5 × 10⁵ cells per millilitre, 3 × 10⁶ cells total, 18–20 h earlier in a T75 flask. The coculture was incubated for 2 h, and the flask was filled with 20 ml of complete growth medium and incubated for 3 days. The viral supernatant from this culture [passage 2 (P2) stock] was used for experiments.
Plaque assay
H1299-E3 cells were plated in a 96-well plate (Corning) at 20 000 cells per well 1 day pre-infection. Virus stocks (used at the 50 focus-forming units per microwell and serially diluted 1:2) were added to cells, incubated for 1 h at 37°C, 5% CO2. Following incubation, 100 μl of a 1× RPMI 1640 (Sigma-Aldrich, R6504), 1.5% carboxymethylcellulose (Sigma-Aldrich, C4888) overlay was added without removing the inoculum. Cells were fixed 72 h postinfection using 4% paraformaldehyde (PFA) (Sigma-Aldrich, P6148) for 20 min. The fixed cells were washed with buffer containing 0.05% Tween-20 in phosphate buffered saline (PBS) and stained with 30 μl/well of a 0.5% crystal violet solution (Sigma-Aldrich, 61 135). After staining, cells were washed with distilled water. Plates were imaged in an ImmunoSpot Ultra-V S6-02-6140 Analyzer ELISPOT instrument with BioSpot Professional built-in image analysis (C.T.L).
Image analysis to determine individual plaque area
Plaque sizes were quantified from well images using Matlab R2025a. First, images were converted from RGB to HSV and the saturation channel was used to convert this image to greyscale. Greyscale images were then preprocessed by stretching along the interval [0.01 0.99], then adjusted using the Matlab imadjust function with gamma = 2. A mask of this image was created, and the image was blurred using an averaging filter in the masked (bright) image region. A second mask was generated of the filtered image with pixels in the well perimeter–assigned ‘1’ values. This mask was inverted, showing pixels in nonplaque regions and the well perimeter as ‘0’ values. This mask was used to segment the plaques, with watershed segmentation separating overlapping plaques. For improved accuracy, manual curation was performed by redrawing individual plaques where automatic segmentation was insufficient or to exclude pipette scratches or other artefacts.
Replication assay by flow cytometry
H1299-E3 cells were plated at 1 × 10⁵ cells per well in 12-well plates (Corning) 1 day pre-infection. The following day, cells were infected with 50 focus-forming units in 200 μl growth media per well. Cell–virus mixtures were incubated for 1 h at 37°C, 5% CO2 followed by 1 ml of growth media. The following days, 24- and 48-h postinfection, cells were trypsinized, collected, and stained with Blue Live/Dead stain as per manufacturer instructions (L34961, ThermoScientific). The samples were then washed in 1 ml PBS and resuspended in Cytofix/Cytoperm buffer (BD Biosciences) for 20 min at 4°C in the dark. The samples were then stained with 0.5 μg/ml anti-SARS-CoV-2 nucleocapsid-PE (ab283244, Abcam) diluted with Perm/Wash buffer (BD Biosciences) containing Fetal Bovine Serum (FBS) and saponin for 1 h at 4°C in the dark. Cells were analysed on a BD FACSymphony. Data was analysed using FlowJo V10.10.0 and Graphpad Prism V10 software.
Live virus focus-forming assay
H1299-E3 cells or VeroE6-TMPRSS2 cells were plated in a 96-well plate (Corning) at 20 000 cells per well 1 day pre-infection. Cells were infected with 100 μl of virus stocks, giving ~100 focus-forming units for 1 h, then 100 μl of a 1× RPMI 1640 (Sigma-Aldrich, R6504), 1.5% carboxymethylcellulose (Sigma-Aldrich, C4888) overlay was added without removing the inoculum. Cells were fixed 18 h postinfection using 4% PFA (Sigma-Aldrich, P6148) for 20 min. Foci were stained with a rabbit anti-spike monoclonal antibody (BS-R2B12, GenScript A02058) at 0.5 μg/ml in a permeabilization buffer containing 0.1% saponin (Sigma-Aldrich, S7900), 0.1% BSA (Biowest, P6154), and 0.05% Tween-20 (Sigma-Aldrich, P9416) in PBS for 2 h at room temperature with shaking, then washed with wash buffer containing 0.05% Tween-20 in PBS. Secondary goat anti-rabbit horseradish peroxidase (HRP) conjugated antibody (Abcam ab205718) was added at 1 μg/ml and incubated for 2 h at room temperature with shaking. TrueBlue peroxidase substrate (SeraCare 5510-0030) was then added at 50 μl per well and incubated for 20 min at room temperature. Plates were imaged in an ImmunoSpot Ultra-VS6-02-6140 Analyzer ELISPOT instrument with BioSpot Professional built-in image analysis (C.T.L), which was also used to quantify areas of individual foci. Microscopy images for Supplementary Fig. S3A were captured with a 10× objective using a Metamorph-controlled (Molecular Devices, Sunnyvale, CA) Nikon TiE motorized microscope (Nikon Corporation, Tokyo, Japan) with an 888 EMCCD camera (Andor).
Neutralization assay
For all neutralization assays, viral input was 100 focus-forming units per well of a 96-well plate. VeroE6-TMPRSS2 cells were plated in a 96-well plate (Corning) at 20 000 cells per well 1 day pre-infection. Plasma was separated from ethylenediaminetetraacetic acid (EDTA)-anticoagulated blood by centrifugation at 500 × g for 10 min and stored at −80°C. Aliquots of plasma samples were heat-inactivated at 56°C for 30 min and clarified by centrifugation at 10 000 × g for 5 min. Virus stocks were added to diluted plasma in neutralization assays. Antibody–virus mixtures were incubated for 1 h at 37°C, 5% CO2. Cells were infected with 100 μl of the virus–antibody mixtures for 1 h, then 100 μl of a 1×RPMI 1640 (Sigma-Aldrich, R6504), 1.5% carboxymethylcellulose (Sigma-Aldrich, C4888) overlay was added without removing the inoculum. Cells were fixed 18 h postinfection, and subsequent steps were performed as described for the live virus focus-forming assay.
Statistics and fitting
All statistics were performed in GraphPad Prism version 9.4.1. All fitting to determine FRNT50 and linear regression was performed using custom code in MATLAB R2025a (FRNT50) or the fitlm function for linear regression, which was also used to determine goodness of fit (R2) as well as P-value by F-test of the linear model.
Neutralization data were fit to:
Here, Tx is the number of foci at plasma dilution D normalized to the number of foci in the absence of plasma on the same plate. ID50 is the plasma dilution giving 50% neutralization. FRNT50 = 1/ID50. Values of FRNT50 < 1 are set to 1 (undiluted), the lowest measurable value. We note that the most concentrated plasma dilution was 1:25, and therefore, FRNT50 < 25 was extrapolated.
Results
Phylogenetic origin of BA.3.2
We examined the phylogenetic origin of BA.3.2. Phylogenetic analysis places BA.3.2 as a direct descendant of BA.3 sequences circulating in Southern Africa in late 2021 to 2022 (Fig. 1A), and BA.3.2 viral sequences originating in South Africa are closest to the BA.3.2 root (Fig. 1A). The emergence of BA.3.2 is estimated to have happened between December 2023 and July 2024 (Fig. 1A). BA.3.2 therefore harbours substantial diversity that has accumulated over at least 1 year. As of writing (October 2025), new sequences of BA.3.2 were recently uploaded to GISAID from Australia, indicating persistent circulation (Fig. 1A). The reconstructed ancestral BA.3.2 sequence differs in the spike protein from its closest BA.3 ancestor by 36 substitutions, two deletions, and one four-amino acid insertions (Fig. 1B).
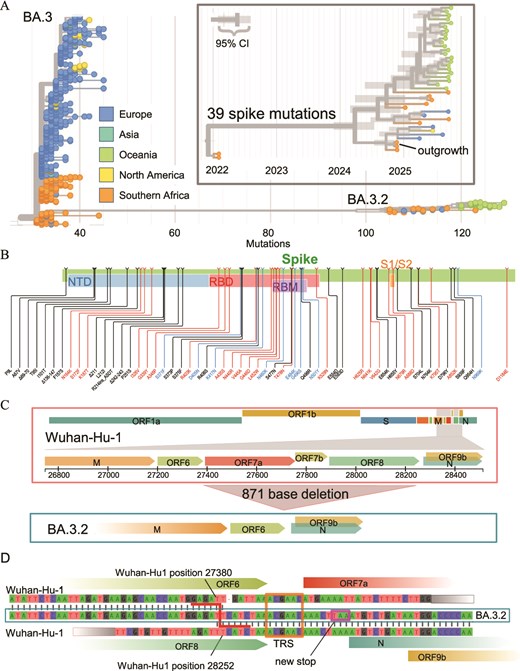
Geographic origin of BA.3.2. (A) Phylogenetic tree of sequences by geographic origin from BA.3 sequences sampled in late 2021/early 2022 and BA.3.2 sequences from 2024 to 2025. BA.3.2 is most closely related to BA.3 sequences from Southern Africa, and basal BA.3.2 sequences also originated in Southern Africa. Inset: time-scaled phylogeny, showing that the common ancestor of BA.3.2 sequences likely circulated in the first half of 2024. (B) Summary of amino acid substitutions, insertions, and deletions in the spike of the inferred root of BA.3.2 relative to the Wuhan-Hu1 reference. (C( The 871 bp deletion in BA.3.2, which removes ORFs 7a, 7b, and 8. (D) Genetic context of the large deletion removing ORFs 7a, 7b, and 8. The BA.3.2 genome (middle) aligns with the reference until reference position 27 380 (top) at the end of ORF6. Then, the sequence switches to reference position 28 252 at the end of ORF8. ORF6 is terminated by a new stop codon immediately in front of the start of ORF N (purple box). Deletions in this area are likely facilitated by transcription regulatory sequence (TRS, orange box) identity.
We isolated BA.3.2.1 virus from a nasopharyngeal swab sample collected in Gauteng Province, South Africa, in November 2024 from a 5-year-old male child (GISAID accession EPI_ISL_19771107). Interestingly, this genome lacks ORF7 and ORF8 due to an 871-base deletion (Fig. 1C). The deletion itself may have been facilitated by sequence similarity between transcription regulatory sites (TRSs) upstream of ORF7 and nucleocapsid (N). The deletion also removed the canonical stop codon of ORF6, which in BA.3.2 is terminated by a new stop codon immediately before N (Fig. 1D).
The 871-base deletion is not reported in the majority (36/40) of genomes shared to date (October 2025). Instead, most genomes report a long stretch of the ambiguous character ‘N’ at this location, presumably indicating lack of coverage. When investigating raw reads underlying the consensus sequences from three samples, we found many reads that cleanly map to both ends of the deletion. Figure S1 illustrates reads from three genomes available to us. In each case, the number of reads spanning the deletion (having at least 25 bases before the deletion followed directly by at least 25 bases after the deletion) is comparable to the coverage of neighbouring amplicons, while we detected few reads mapping to the deleted region (Fig. S1). The lack of reported deletions in public databases is probably due to the inability of genome assembly pipelines to correctly process deletions that are much longer than individual reads. We conclude that this deletion is likely present in almost all BA.3.2 sequences to date.
BA.3.2 virological characteristics
To test viral properties, we used H1299 cells overexpressing the ACE2 receptor (Cele et al. 2021) to compare cytopathic effects, replication, and cell-to-cell spread. We also used Vero-E6 cells overexpressing TMPRSS2 (Vero-TMPRSS2) (Matsuyama et al. 2020) to assess cell-to-cell spread. H1299 cells have been previously reported to have a functional interferon response (Machitani et al. 2017, Reisländer et al. 2019, Gao et al. 2021, Zhang et al. 2021a, Duncan et al. 2023, Khan et al. 2023). They have low levels of TMPRSS2 and have been shown to be predominantly infected by SARS-CoV-2 through the endocytic pathway, where viral fusion is activated by cathepsin spike cleavage (Meng et al. 2022). In contrast, the overexpression of TMPRSS2 on Vero cells should promote infection through the plasma membrane (Meng et al. 2022).
We quantified cytopathic effect (CPE) at 72 h postinfection by plaque size, which represents the area of dead cells resulting from one infectious viral unit. We used a range of low input virus titres, which we determined in the same experiment 24 h postinfection by a focus-forming assay (Fig. S2, Materials and Methods). Plaque size was quantified by a bespoke image analysis pipeline (Fig. 2A, Materials and Methods). To compare plaque areas relative to BA.3.2, we calculated the geometric mean of BA.3.2 plaque areas in pixels. We then divided each plaque area for all strains by the BA.3.2 plaque geometric mean. Plaque areas varied between strains, being largest in the Delta variant–infected cells and smallest in JN.1 Omicron subvariant infections (Fig. 2B). BA.3.2 had significantly smaller plaques relative to Delta (3.2-fold smaller, P < .0001, by the Wilcoxon rank-sum test with Benjamini–Hochberg correction for multiple hypotheses), ancestral virus with the D614G mutation (henceforth D614G, 2.5-fold, P < .0001), and BA.1 (1.4-fold, P = .001) but twice larger than JN.1 (P = .04). BA.3.2 plaque areas were not significantly different than those made by LP.8.1 (Fig. 2B).
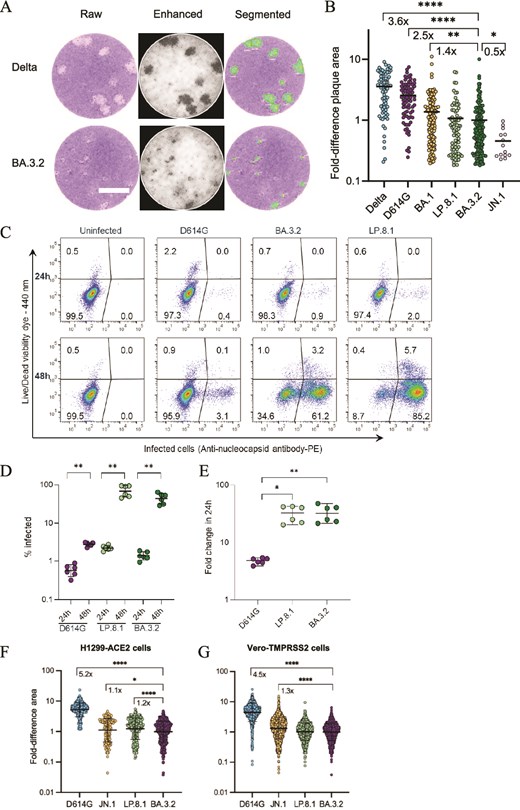
BA.3.2 infection in cell culture. (A, B) H1299-ACE2 cells were infected with Delta, D614G, BA.1, BA.3.2, LP.8.1, and JN.1 viruses and plaques resulting from infected cell death were quantified 72 h postinfection. Image analysis is shown in (A), and plaque sizes per strain normalized by the geometric mean plaque size for BA.3.2 are shown in (B). Bars are geometric means of fold difference versus BA.3.2. Plaque numbers are n = 76 for Delta, n = 82 for D614G, n = 141 for BA.1, n = 76 for LP.8.1, n = 159 for BA.3.2, n = 14 for JN.1 from three independent experiments. *P = .04, **P = .001, ****P < 10−4 determined by the Wilcoxon test with Benjamini–Hochberg multiple hypothesis correction. Bar is 2 mm. (C) Representative dot plots of infected cells detected using anti-SARS-CoV-2 nucleocapsid antibody staining followed by flow cytometry 24 and 48 h postinfection (x-axis), with the y-axis showing live versus dead cells. (D) Quantified percentage of infected cells at 24 and 48 h for D614G, LP.8.1, and BA.3.2 infections. Bars are medians and error bars are 95% confidence intervals from three independent experiments with three repeats each. **P = .002 by two-tailed Mann–Whitney test. (E) Fold change in infected cells quantified as the proportion infected at 48 h divided by the median proportion of infection at 24 h. *P = .01, **P = .009 by the two-tailed Kruskal–Wallis test with Dunn multiple hypothesis correction. (F) Fold-difference in focus area relative to BA.3.2 focus geometric mean area in H1299-ACE2 cells. (G) Fold difference in focus area relative to BA.3.2 focus geometric mean area in Vero-TMPRSS cells. *P = .03, ****P < 10−4 determined by the Wilcoxon test with Benjamini–Hochberg multiple hypothesis correction.
We also measured viral replication in H1299-ACE2 cells over 24 h. For this, we compared the ratio of infected cells in the same infection 24 versus 48 h postinfection. We detected SARS-CoV-2-infected cells by staining with an antibody to the SARS-CoV-2 nucleoprotein followed by flow cytometry (Fig. 2C, Materials and Methods). This assay has the advantage that it measures productively infected cells, not virus copies, some of which may be defective. We tested ancestral SARS-CoV-2 with D614G, LP.8.1, and BA.3.2. At 24 h, H1299-ACE2 cells infected with D614G showed a median infection of 0.6%, increasing to a median of 2.9% at 48 h (P = .002 by the Mann–Whitney nonparametric test, Fig. 2D), while LP.8.1 increased from a median of 2.2%–74% (P = .002) and BA.3.2 increased from a median of 1.3%–48% (P = .002). To calculate fold change, we divided the percent infected cells after 48 h infection by the median percentage at 24 h. Both BA.3.2 and LP.8.1 had a median 33-fold increase over 24 h (Fig. 2E). This was significantly higher than D614G, which showed a median 4.8-fold-increase over the 24-h time period (P = .009 for BA.3.2, P = .01 for LP.8.1 by the Kruskal–Wallis test with the Dunn–Sidak correction for multiple hypotheses). Hence, BA.3.2 and LP.8.1 had similar replication in this cell line.
Lastly, we measured the focus size of D614G, JN.1, LP.8.1, and BA.3.2 in H1299-ACE2 (Fig. 2F) and Vero-TMPRSS2 (Fig. 2G) cells. We have previously found D614G infection foci have large, infected cells at the centre, consistent with cell fusion, surrounded by smaller satellite-infected cells (Fig. S3A). Similar large foci were observed with D614G but not with Omicron subvariants in the current experiments in H1299-ACE2 and Vero-TMPRSS2 cells (Fig. S3B). To compare focus areas relative to BA.3.2, we calculated the geometric mean BA.3.2 focus area and divided each focus area for all strains by the BA.3.2 geometric mean. Unlike in the replication experiments, where infection was not restricted to cell-to-cell spread, in this assay, D614G had a substantially larger geometric mean focus area relative to BA.3.2 (5.2-fold in H1299-ACE2 and 4.5-fold in Vero-TMPRSS2 cells, P < .0001 for both by the Wilcoxon rank-sum test with Benjamini–Hochberg correction for multiple hypotheses). Unlike in the plaque assay, where JN.1 had significantly smaller plaques relative to BA.3.2, in this assay, JN.1 had moderately but significantly larger foci. Like in the CPE and replication experiments, BA.3.2 foci were very similar to LP.8.1 foci in area: LP.8.1 showed moderately (1.2-fold) but significantly (P < .0001) larger foci in H1299-ACE2 but no difference in Vero-TMPRSS2 cells.
Immune escape through time
To test BA.3.2 escape from neutralizing antibodies and compare it to other SARS-CoV-2 subvariants, we used plasma from participants collected at different times in the pandemic in South Africa (Table 1). The first set of plasma samples was collected before Omicron arose at the end of 2021. This plasma was from convalescent participants ~1 month postinfection, where infection was by D614G, Beta, or the Delta variant of SARS-CoV-2 (Khan et al. 2022, Cele et al. 2022a, Cele et al. 2022b). No participant in this group was vaccinated before blood was collected.
Participant characteristics of plasma used in neutralization experiments
| Pre-Omicron samples | 2024 samples | 2025 samples | |
|---|---|---|---|
| Number of participants | 19 | 30 | 30 |
| Age (median, IQR) | 45 (40–55) | 33 (28–42) | 38 (33–49) |
| Female (n, %) | 10 (53%) | 16 (53%) | 22 (73%) |
| Date range of collection | Jul 2020–Aug 2021 | Feb 2024 | Mar 2025 |
| Days diagnosis to sample (median, IQR) | 32 (25–37) | N/A1 | N/A1 |
| PLWH (n, %) | 7 (37%) | 15 (50%) | 11 (37%) |
| HIV viral load (median, IQR) | 40 (40–323) | 40 (40–199) | 40 (40–43) |
| CD4 count (median, IQR) | 908 (657–1237) | 716 (470–899) | 1017 (768–1358) |
| Vaccinated (n, %) | 0 (0%) | 2 (7%) | 7 (23%) |
1not applicable
More recently, it has been difficult to enrol confirmed SARS-CoV-2 cases since testing has been discontinued. Therefore, to assess more recent antibody immunity, we enrolled participants without SARS-CoV-2 symptoms and without knowing their infection history. Even pre-Omicron, seroprevalence of SARS-CoV-2 infection in South Africa was ~60%–70% (Kleynhans et al. 2022) and we therefore expected that the more recently enrolled participants would have an exposure to SARS-CoV-2 through infection, vaccination, or both. Enrollment for the first group was in February 2024, when JN.1 was circulating. Enrollment for the second group was in March 2025, when LP.8.1 was circulating (Fig. 3A). A minority were vaccinated (Table 1). HIV prevalence, which was between 37% and 50%, was consistent with the previously reported high prevalence in the KwaZulu-Natal area where our study is based (Kharsany et al. 2018, Karim et al. 2021), although measured median CD4 counts and HIV viral loads indicated that participants living with HIV had controlled HIV infections (Table 1).
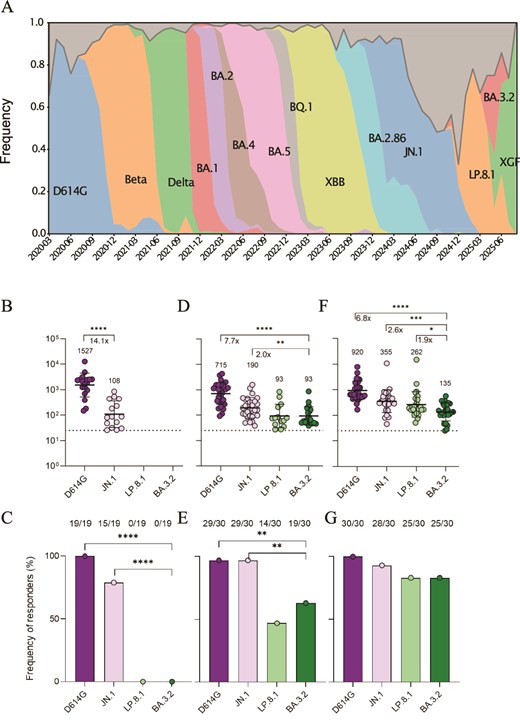
BA.3.2 neutralization at different times in the pandemic. (A) Variant frequency in South Africa over time. (B) D614G, JN.1, LP.8.1, and BA.3.2 neutralization by pre-2022 plasma from infected unvaccinated South Africans. In (B, D, E), points are values and bars are geometric mean titres of values only above the limit of quantification (LOQ, denoted by dashed line at FRNT50 = 25, the most concentrated plasma used). ****P < 10−4 by two-tailed Wilcoxon test. C) Frequency of responders in (B), defined as participants able to neutralize above the LOQ. ****P < 10−4 by Fisher’s exact test. (D) Neutralization by February 2024 collected plasma from South Africans with no Covid-19 symptoms. ****P < 10−4 by two-tailed Wilcoxon test. (E) Frequency of responders in (D). **P = .003 by Fisher’s exact test. (F) Neutralization by March 2025 collected plasma from South Africans with no Covid-19 symptoms. ****P < 10−4, **P = .006 by two-tailed Wilcoxon test. (G) Frequency of responders in (F).
To quantify neutralization, we used the focus reduction neutralization 50% titre (FRNT50), the inverse of the plasma dilution that neutralized 50% of the virus as detected in a live virus focus-forming assay. Plasma collected pre-Omicron showed strong neutralization of D614G virus (Fig. 3B) with all participants able to neutralize this strain (Fig. 3C) above the limit of quantification (FRNT50 = 25, corresponding to a 1:25 plasma dilution, the most concentrated plasma used). JN.1 neutralization was 21-fold lower for these participants. However, as previously reported for the BA.1 subvariant (Cele et al. 2022a), escape was not complete, with 15 out of 19 tested participants (79%) able to neutralize the virus above the limit of quantification (Fig. 3C). Neutralization of LP.8.1 and BA.3.2 was below the level of quantification for all participants (Fig. 3C).
Plasma samples collected from 2024 participants showed higher neutralization of JN.1 and lower neutralization of D614G relative to the plasma of pre-Omicron participants (Fig. 3D). The fraction of neutralizers increased for JN.1 to 29 out of 30 (97%) and was the same as for D614G (Fig. 3E). Neutralization of LP.8.1 and BA.3.2 increased to low but detectable levels (Fig. 3D), with 19/30 participants showing an ability to detectably neutralize BA.3.2 (Fig. 3E). This proportion was not significantly different from LP.8.1 (Fig. 3E). BA.3.2 showed 21.6-fold lower neutralization relative to D614G and 6-fold lower neutralization relative to JN.1 (Fig. 3D).
In 2025, there was a further increase in neutralization capacity against both LP.8.1 and BA.3.2 (Fig. 3F), and 25/30 of the plasma samples neutralized BA.3.2 above the limit of quantification (Fig. 3G). However, neutralization of this subvariant was significantly lower than D614G (by 9.6-fold) and JN.1 (3-fold). It was also moderately but significantly lower than LP.8.1 (1.6-fold), with LP.8.1 circulating at the time of collection (Fig. 3A).
Antigenic cartography of the viral strains against all plasma samples showed D614G virus to be at the centre, surrounded by plasma samples from the three participant groups. It was the most neutralized virus over time. The virus with the shortest antigenic distance from D614G was JN.1, while BA.3.2 and LP.8.1 were antigenically removed from both D614G and JN.1 (Fig. 4). With time, plasma samples reduced antigenic distance to both LP.8.1 and BA.3.2.
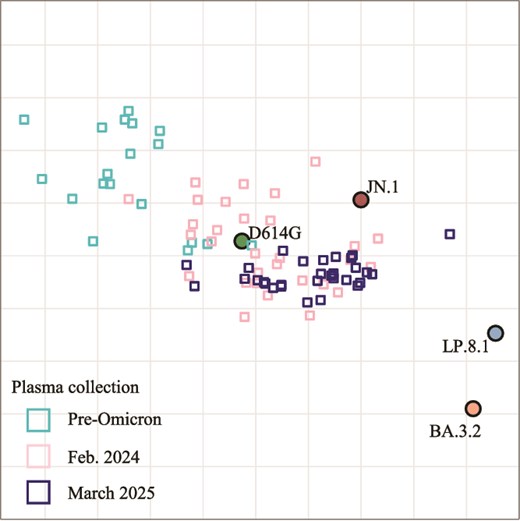
Antigenic cartography shows separation of BA.3.2 from plasma collected at different times in the pandemic. Circles are viruses, small squares are plasma collected pre-Omicron, in 2024, or in 2025.
Discussion
In this study, we investigated the geographic origin and properties of the Omicron BA.3.2 subvariant, which was isolated as the BA.3.2.1 sub-lineage. The putative ancestor BA.3.2 has not been sampled. It is unclear whether BA.3.2.1 and BA.3.2.2 emerged from one infected individual or whether this diversity is due to low-level circulation in the population. We found that BA.3.2 likely evolved in Southern Africa in the first half of 2024. A subsequent report presents additional evidence for Southern African origin (Dor et al. 2025a). The Southern African region gave rise to other variants and subvariants like Beta, BA.1, BA.2, BA.3, and BA.2.86, the precursor to JN.1 (Sigal et al. 2024, Dor et al. 2025b). Beta showed extensive infection in the Southern African region, with high morbidity and mortality (Cele et al. 2021, Karim et al. 2021), while BA.1, BA.2, and JN.1 spread worldwide. One explanation for the region being a hotspot for SARS-CoV-2 variant evolution is the high prevalence of HIV infection. About 10% of people living with HIV in the region may not effectively suppress the virus with antiretroviral drugs because of lack of access or adherence to antiretroviral therapy (Carmona et al. 2018, Sigal et al. 2024). Therefore, the high HIV prevalence translates to a large group of people with immunocompromise due to advanced HIV disease. Our previous work and that of others showed persistent SARS-CoV-2 infections and extensive SARS-CoV-2 evolution in immunocompromised people, including those with advanced HIV disease (Avanzato et al. 2020, Choi et al. 2020, Kemp et al. 2021, Meiring et al. 2022, Wilkinson et al. 2022, Cele et al. 2022b, Chaguza et al. 2023, Maponga et al. 2023, Karim et al. 2024, Lustig et al. 2024, Machkovech et al. 2024).
For neutralization, our results were broadly consistent with previous studies (Sigal et al. 2024, Guo et al. 2025) showing BA.3.2 to have strong escape from neutralizing antibodies elicited by previous SARS-CoV-2 exposures. However, we also observed that neutralizing antibody immunity against BA.3.2 increased with time and that most 2025 plasma samples from participants enrolled in the geographical region in which BA.3.2 likely evolved show detectable neutralization of this subvariant. However, neutralization of BA.3.2 is still significantly lower than the cocirculating LP.8.1 subvariant. One possible explanation is that, since LP.8.1 was circulating at relatively high levels in South Africa relative to BA.3.2, some of our participants may have been infected with LP.8.1 and developed specific immunity to it. Furthermore, LP.8.1 is a JN.1-derived subvariant, while BA.3.2 is not. It is reasonable to assume that neutralizing antibodies elicited by JN.1 infection may be more highly cross-reactive against LP.8.1 than BA.3.2.
We found that many reported BA.3.2 sequences are compatible with the deletion of 871 bases, which results in the deletion of ORF8, as well as ORF7a and ORF7b. This has been confirmed in a subsequent analysis (Dor et al. 2025a). ORF8 is reported to interfere with type 1 interferon signalling (Li et al. 2020) and downregulate MHC-I (Zhang et al. 2021b). ORF8 also increases endoplasmic reticulum stress, which may accelerate cell death (Arduini et al. 2023). Deletion of ORF8 is common (DeRonde et al. 2022) and may be positively selected in SARS-CoV-2 Omicron subvariants (Wagner et al. 2024). In one study, individuals infected with SARS-CoV-2 with an ORF8 deletion mutant were reported to show milder disease (Young et al. 2020), although other studies showed little effect of an ORF8 deletion on replicative fitness (Su et al. 2020) or host transcriptional response (Gamage et al. 2020). These deletions may potentially lead to milder disease. However, BA.3.2 harbours numerous concurrent mutations. Without further data (e.g. ORF8-restored BA.3.2), it will be difficult to attribute any BA.3.2 phenotype to the deletion.
BA.3.2 showed similar cytotoxicity measured as plaque area to LP.8.1 in H1299-ACE2 cells, despite the previously reported reduced entry (Zhang et al. 2025) and low infectivity (Guo et al. 2025) relative to LP.8.1. Delta and ancestral SARS-CoV-2, which have been reported to cause more severe disease than Omicron subvariants (Sigal et al. 2022), show cell culture phenotypes such as increased cytotoxicity relative to Omicron (Suzuki et al. 2022, Khan et al. 2023, Tanneti et al. 2024). This is consistent with our observation that the plaques Delta and ancestral SARS-CoV-2 form are larger than those of Omicron subvariants. Interestingly, JN.1 made plaques that were about half the area of BA.3.2, despite having larger infection foci, indicating JN.1 may be less cytotoxic than BA.3.2.
To measure replication, we used an assay which measured the number of infected cells in the same infection 24 h apart. We believe this is a more direct measure of infection dynamics than measuring viral copies that may be defective. BA.3.2 and LP.8.1 showed similar replication, which was higher than that of D614G, as expected in cells that are predominantly infected through the endocytic pathway (Meng et al. 2022, Willett et al. 2022, Zhao et al. 2022). In contrast, we observed substantially larger infection foci made by the D614G virus than Omicron subvariants. This is expected since Omicron subvariants have reduced ability to induce fusion at the plasma membrane (Matsuyama et al. 2020, Kimura et al. 2022, Meng et al. 2022, Saito et al. 2022, Suzuki et al. 2022, Tamura et al. 2023). Foci made by BA.3.2 were similar in area to those made by LP.8.1, consistent with a previous study showing the spikes of BA.3.2 and LP.8.1 induce similar degrees of cell-to-cell fusion (Zhang et al. 2025).
The similarity we observed in terms of cytotoxic effect, replication, and cell-to-cell spread between BA.3.2 and LP.8.1 indicates that, in contrast to data obtained from pseudovirus infection (Guo et al. 2025), BA.3.2 live virus does not seem to have a growth disadvantage in the cell types examined relative to LP.8.1.
Limitations of the study include the undefined infection history of participants enrolled in 2024 and 2025. In addition, H1299-ACE2 cells, while convenient for assays such as CPE since they form well-defined and reproducible monolayers (Cele et al. 2022a), may not reflect infection in cells with endogenous ACE2 levels, primary cells with intact regulatory pathways, or cells where the main infection route is thorough the plasma membrane (Meng et al. 2022, Willett et al. 2022).
BA.3.2 infections have been expanding slowly, and the potential of BA.3.2 or its descendants to further evolve and expand is unclear. The BA.2.86 variant showed slow expansion until it evolved the L455S mutation to become JN.1, which spread globally. More broadly, the continual evolution of long branch variants in Southern Africa (Sigal et al. 2024, Dor et al. 2025b) may point to continuing SARS-CoV-2 evolution in persistent infections in people immunocompromised because of advanced HIV disease (Sigal et al. 2024). Erosion of the ability to deliver antiretroviral therapy to people living with HIV may increase the number of people with advanced HIV disease and lead to further evolution of SARS-CoV-2 and other viruses.
Acknowledgements
This study was supported by the Wellcome Trust Award 226137/Z/22/Z (A.S.). The Africa Health Research Institute is supported by the Wellcome Strategic Core award 227167/A/23/Z. The funders had no role in study design, data collection and analysis, decision to publish, or preparation of the manuscript. We gratefully acknowledge the originating and submitting laboratories of the genetic sequence and metadata made available through INSDC or GISAID on which the phylogenetic analysis in this paper is based (EPI_SET_251022ev). We also gratefully acknowledge the public and private laboratories in South Africa sharing SARS-CoV-2 specimens for sequencing as part of the national genomic for SARS-CoV-2, which enabled both the phylogenetic analysis and the isolation of live SARS-CoV-2 strains from the residual samples.
Conflicts of interest
None declared.
Funding
None declared.